


Greetings fellow traders. In this technical article we’re going to take a quick look at the Elliott Wave charts of EURUSD, published in members area of the website. As our members know, EURUSD has ended the cycle from the December's 2023 peak. The pair has recently pulled back in a 3-wave pattern, with buyers stepping in right at the equal legs zone. Let’s break down our Elliott Wave forecast further in this article.
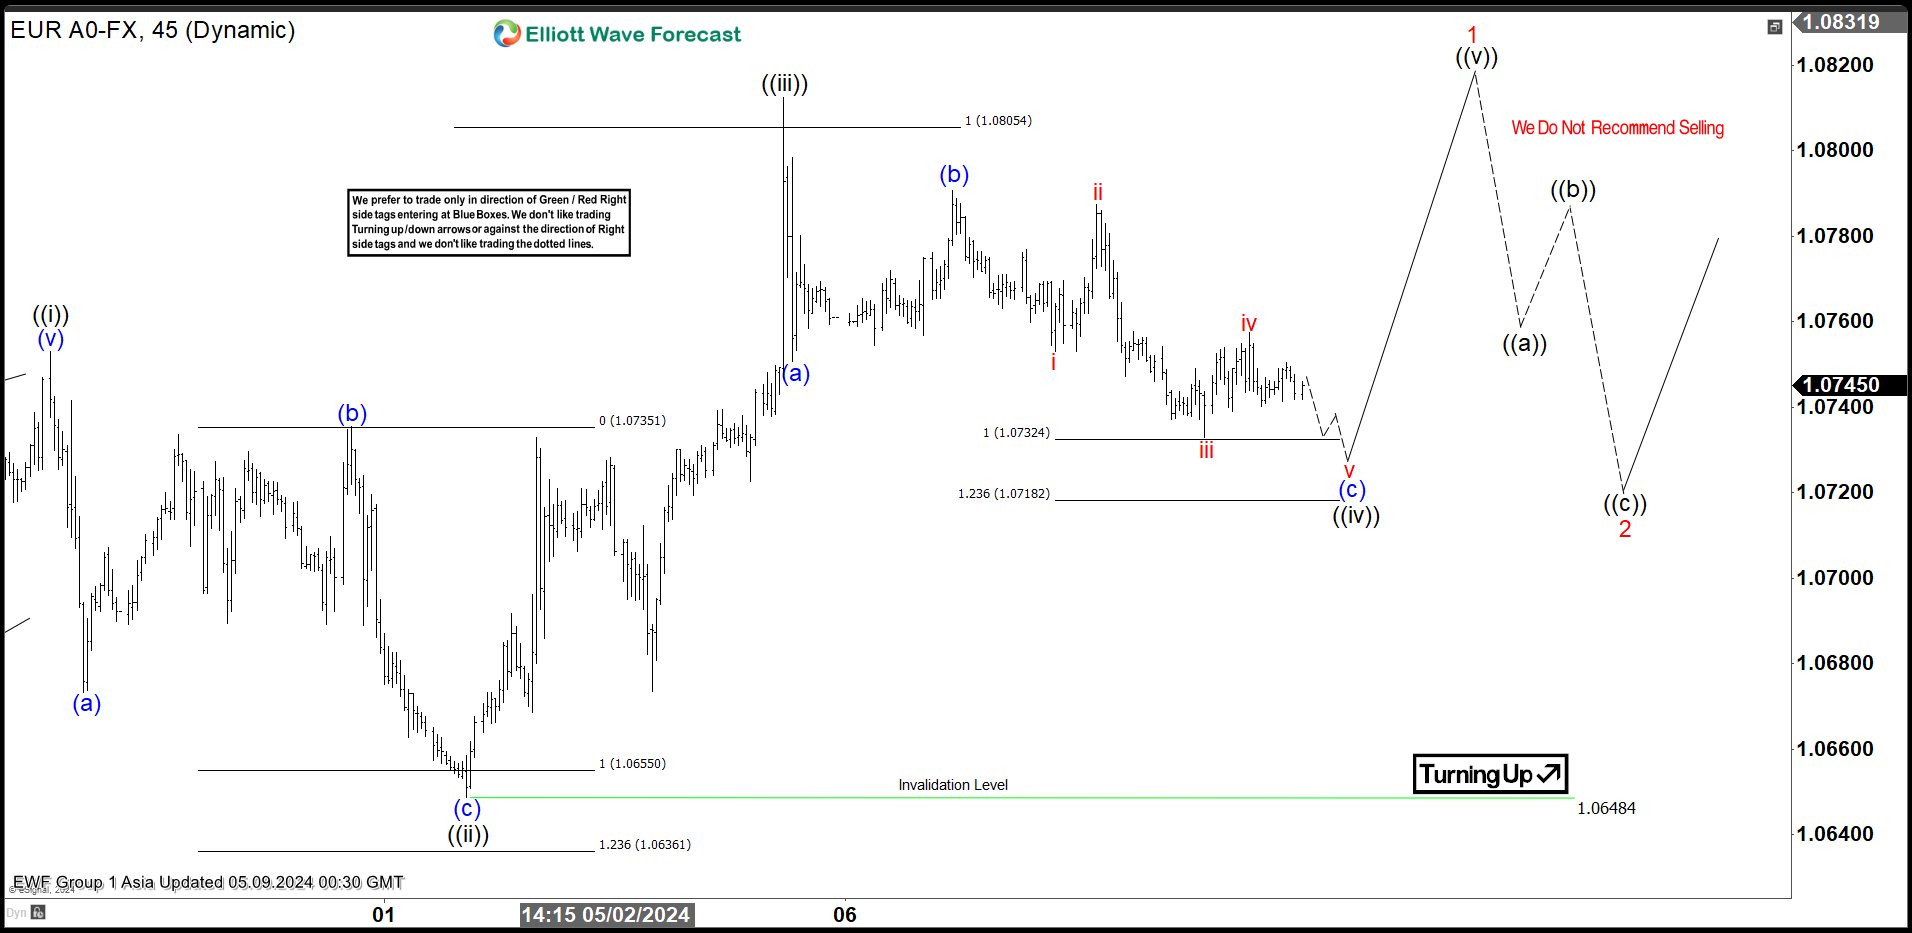
EURUSD H1 Asia Update 05.09.2024
The current view suggests that the EURUSD pair is doing a ((iv)) pullback, which is correcting the cycle from the 1.0648 low. This pullback still looks incomplete at the moment. We expect to see another leg down toward equal legs area : 1.07324-1.07182. We expect potential buyers to appear in this area, which could lead to a further rally towards new high or a three-wave bounce at least.
Reminder : You can learn more about Elliott Wave Patterns at our Free Elliott Wave Educational Web Page.
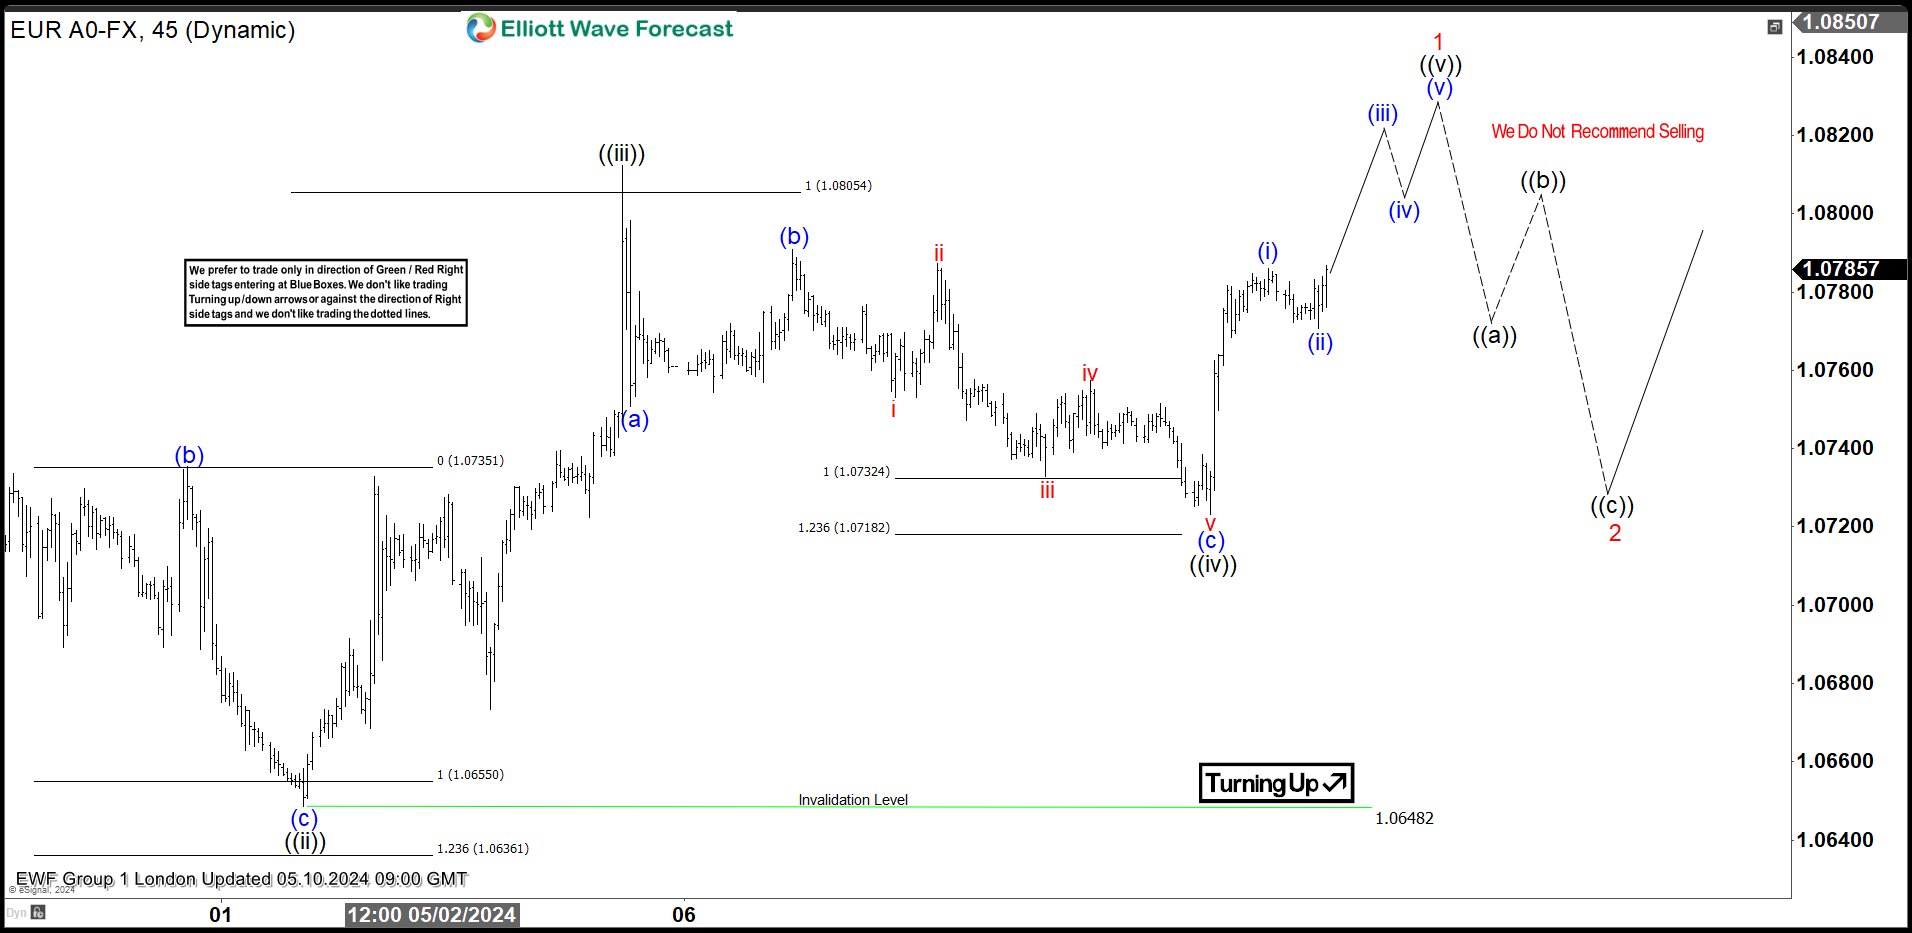
EURUSD H1 London Update 05.10.2024
EURUSD has made a nice bounce from the Equal Legs-Buyers zone, as anticipated. We consider the wave ((iv)) pullback completed at the 1.0725 low. Confirmation of the next leg up will come with a break of the ((iii)) black peak. We advise against selling the pair during any suggested pullback and favor the long side.
Remember, the market is dynamic, and the presented view may have changed in the meantime. For the most recent charts and target levels, please refer to the membership area of the site. The best instruments to trade are those with incomplete bullish or bearish swing sequences. We put them in Sequence Report and best among them are presented in the Live Trading Room
New to Elliott Wave ? Check out our Free Elliott Wave Educational Web Page and download our Free Elliott Wave Book.
風險提示:本文所述僅代表作者個人觀點,不代表 Followme 的官方立場。Followme 不對內容的準確性、完整性或可靠性作出任何保證,對於基於該內容所採取的任何行為,不承擔任何責任,除非另有書面明確說明。
 暫無留言。 來發表第一則觀點吧。