


TRADERS HAVE REDUCED THE NUMBER OF LONG POSITIONS BY 53.341K OVER THE PAST WEEK
| Scenario | |
|---|---|
| Timeframe | Weekly |
| Recommendation | SELL STOP |
| Entry Point | 81.50 |
| Take Profit | 78.70 |
| Stop Loss | 83.00 |
| Key Levels | 78.70 , 81.50, 83.20, 86.10 |
| Alternative scenario | |
|---|---|
| Recommendation | BUY STOP |
| Entry Point | 83.20 |
| Take Profit | 86.10 |
| Stop Loss | 82.00 |
| Key Levels | 78.70 , 81.50, 83.20, 86.10 |
Current trend
Prices for benchmark Brent Crude Oil are correcting slightly above 82.00: downward dynamics are developing against easing tensions in the Middle East, where representatives of the Hamas movement confirmed their readiness for a possible ceasefire, and the Houthis reduced the intensity of attacks on ships in the Red Sea.
Another reason for the stabilization of the quotes is the reduction in demand for oil contracts: according to data from the ICE Futures Europe platform, the number of long positions over the last week decreased by 53.341K, reaching 341.835K. The Chicago Mercantile Exchange (CME Group) also observed a decrease in trading volumes: 9 and 10 of May, 746.0K and 747.0K transactions were recorded, while a week earlier, more than 1.0M contracts were recorded per day.
Meanwhile, Iraqi Oil Minister Hayyan Abdul Ghani said that the country would refuse to extend the agreement to reduce production under the OPEC agreement at the next meeting. However, the next day, his deputy Basim Mohammed Khudayr denied these comments and said that the official was referring to the complexity compliance with current limits that negatively affect the country’s economy. Against this background, it is unknown how Iraq will behave at the next meeting of the cartel but it is already clear that many participants of the agreement are ready to increase production levels.
Support and resistance
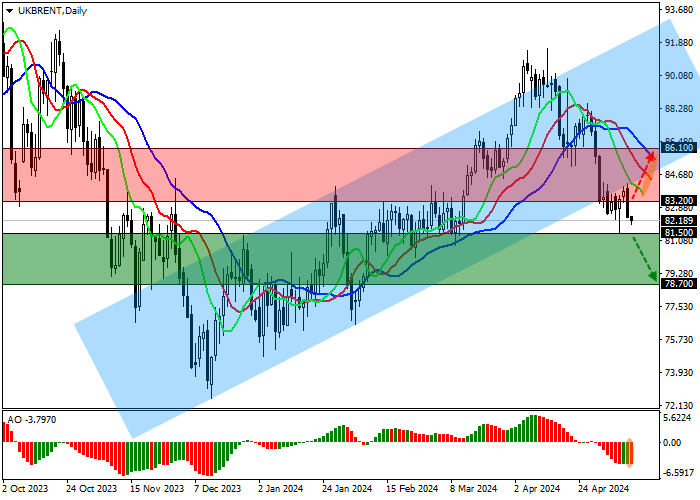
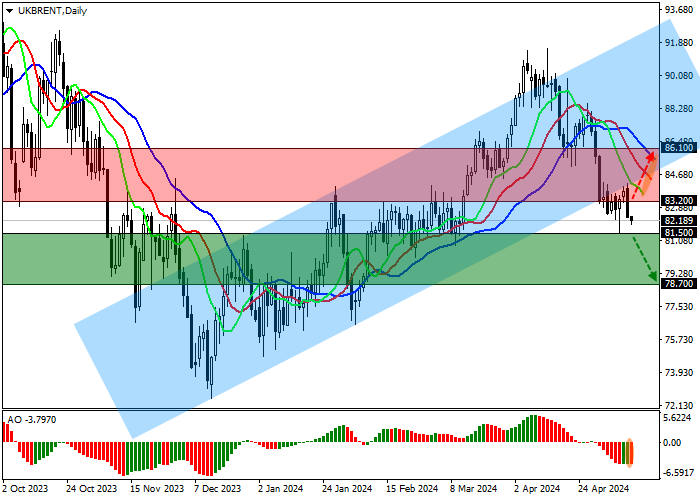
On the daily chart, the trading instrument is in a corrective trend, moving away from the support line of the ascending corridor 93.00–86.00.
Technical indicators keep the sell signal: fast EMA of the Alligator indicator are moving away from the signal line, and the AO histogram is forming downward bars in the sales zone.
Resistance levels: 83.20, 86.10.
Support levels: 81.50, 78.70.
Trading tips
Short positions may be opened after the price declines and consolidates below 81.50, with the target at 78.70. Stop loss – 83.00. Implementation period: 7 days or more.
Long positions may be opened after the price rises and consolidates above 83.20, with the target at 86.10. Stop loss – 82.00.
風險提示:本文所述僅代表作者個人觀點,不代表 Followme 的官方立場。Followme 不對內容的準確性、完整性或可靠性作出任何保證,對於基於該內容所採取的任何行為,不承擔任何責任,除非另有書面明確說明。
 暫無留言。 來發表第一則觀點吧。