


| Scenario | |
|---|---|
| Timeframe | Weekly |
| Recommendation | SELL STOP |
| Entry Point | 253.95 |
| Take Profit | 245.00 |
| Stop Loss | 260.00 |
| Key Levels | 245.00, 254.00, 260.00, 267.00 |
| Alternative scenario | |
|---|---|
| Recommendation | BUY STOP |
| Entry Point | 260.05 |
| Take Profit | 267.00 |
| Stop Loss | 256.00 |
| Key Levels | 245.00, 254.00, 260.00, 267.00 |
Current trend
Shares of Visa Inc., the largest American multinational company providing payment transaction services, are adjusting at around 258.00.
According to the financial report for the third quarter, the company's revenue amounted to 8.9 billion dollars, losing the forecast of 8.92 billion dollars, but exceeding 8.12 billion dollars in revenue a year earlier. Earnings per share (EPS) reached 2.42 dollars, which fully coincided with preliminary expectations.
The downtrend in quotes is intensified due to unstable financial indicators and penalties from the Reserve Bank of India (RBI) for 24.1 million rupees for using its own method of authenticating payment transfers within the country without prior approval from the regulator. Visa Inc. agreed with the accusation and expressed interest in further following the RBI rules, not wanting to lose even a minimal market share.
Despite the above-mentioned problems, Argus Research Co. experts confirmed the issuer's rating at the "buy" level, but lowered the target price from 310.0 dollars to 295.0 dollars per share. Analysts noted a slowdown in the growth of the company's payment volumes to 7.0% after an increase of 8.0% and a correction in the number of cross-border transfers by 14.0% after a rise of 16.0% earlier.
Support and resistance
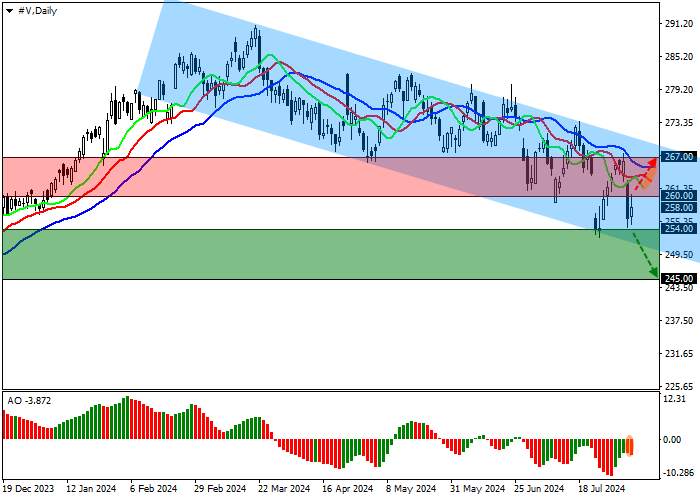
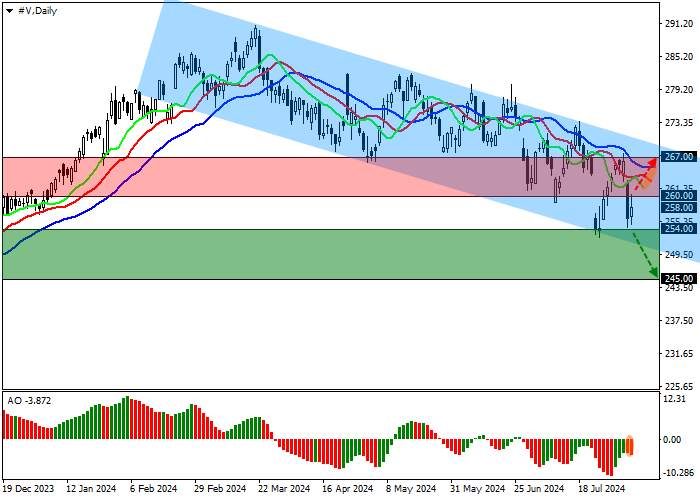
On the D1 chart, the asset is held within the correction channel with the boundaries of 269.00–248.00, preparing for a continuation of the decline.
The global sell signal from technical indicators is actively strengthening: the range of EMAs fluctuations on the Alligator indicator is actively expanding, and fast EMAs are moving away from the signal line, while the AO histogram, trading in the negative zone, forms new descending bars.
Support levels: 254.00, 245.00.
Resistance levels: 260.00, 267.00.
Trading tips
In case of a reversal and continued decline of the asset, as well as price consolidation below the support level of 254.00, one can open short positions with the target of 245.00 and stop-loss of 260.00. Implementation period: 7 days and more.
If the asset continues to grow and the price consolidates above the resistance level of 260.00, one may open long positions with the target of 267.00 and stop-loss of 256.00.
風險提示:本文所述僅代表作者個人觀點,不代表 Followme 的官方立場。Followme 不對內容的準確性、完整性或可靠性作出任何保證,對於基於該內容所採取的任何行為,不承擔任何責任,除非另有書面明確說明。

暫無評論,立馬搶沙發