| Scenario | |
|---|---|
| Timeframe | Weekly |
| Recommendation | SELL STOP |
| Entry Point | 17630.0 |
| Take Profit | 17020.0 |
| Stop Loss | 18000.0 |
| Key Levels | 17020.0, 17630.0, 17900.0, 18500.0 |
| Alternative scenario | |
|---|---|
| Recommendation | BUY STOP |
| Entry Point | 17900.0 |
| Take Profit | 18500.0 |
| Stop Loss | 17400.0 |
| Key Levels | 17020.0, 17630.0, 17900.0, 18500.0 |
Current trend
The leading index of the Frankfurt Stock Exchange DAX 40 is correcting around 17793.0.
Against the backdrop of the final stage of the publication of corporate reports, macroeconomic statistics are once again coming to the fore: so, the consumer price index (CPI) has corrected from 0.1% to 0.3% MoM and from 2.2% to 2.3% YoY, and the harmonized indicator has corrected from 0.2% to 0.5% MoM and from 2.5% to 2.6% YoY, confirming the continuing pressure on the region's economy.
Today, the financial results of the insurance company Hannover Rück SE will be published, with revenue forecast at 6.02 billion euros, below the previous figure of 6.67 billion euros, as well as 7.32 billion euros over the same period a year earlier.
The domestic bond market remains in correction, allowing the DAX 40 quotes to hold at current levels: for example, the yield on 10-year German debt securities fell to 2.220% from 2.269% recorded last week, and on 20-year ones – to 2.475% from 2.515%.
The growth leaders in the index are Rheinmetall AG ( 5.24%), Vonovia SE ( 3.04%), Siemens Healthineers AG ( 1.99%), Deutsche Bank AG ( 1.53%).
Bayer AG (˗1.48%), Siemens AG Class N (˗1.27%), Siemens Energy AG (˗0.82%) are among the leaders of the decline.
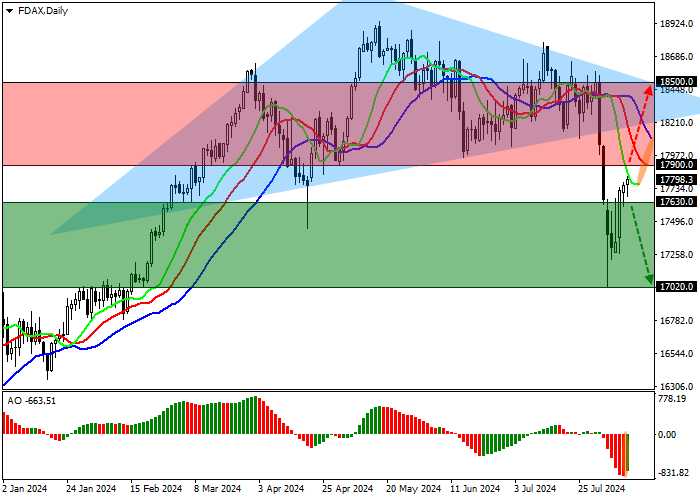
Support and resistance
On the D1 chart, the price is trading in a correction trend, falling and working out the signal of the "head and shoulders" pattern with the "neck" line at 17900.0.
Technical indicators do not react to the local correction and maintain a stable sell signal: fast EMAs on the "Alligator" indicator are below the signal line for a long time, and the AO histogram, located in the sales zone, forms descending bars.
Support levels: 17630.0, 17020.0.
Resistance levels: 17900.0, 18500.0.

Trading tips
If the decline continues and the price consolidates below the support level of 17630.0, sell positions with the target of 17020.0 will be relevant. Stop loss – 18000.0. Implementation period: 7 days or more.
If the growth continues and the price consolidates above the resistance level of 17900.0, buy positions with the target of 18500.0 can we opened. Stop loss – 17400.0.
風險提示:本文所述僅代表作者個人觀點,不代表 Followme 的官方立場。Followme 不對內容的準確性、完整性或可靠性作出任何保證,對於基於該內容所採取的任何行為,不承擔任何責任,除非另有書面明確說明。

暫無評論,立馬搶沙發