


| Scenario | |
|---|---|
| Timeframe | Weekly |
| Recommendation | BUY STOP |
| Entry Point | 125.05 |
| Take Profit | 131.25 |
| Stop Loss | 120.00 |
| Key Levels | 100.00, 106.25, 115.62, 125.00, 131.25 |
| Alternative scenario | |
|---|---|
| Recommendation | BUY LIMIT |
| Entry Point | 115.62 |
| Take Profit | 131.25 |
| Stop Loss | 111.00 |
| Key Levels | 100.00, 106.25, 115.62, 125.00, 131.25 |
Current trend
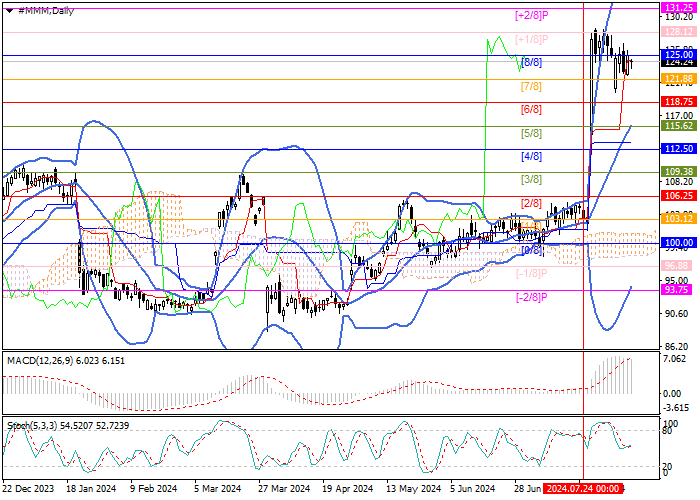
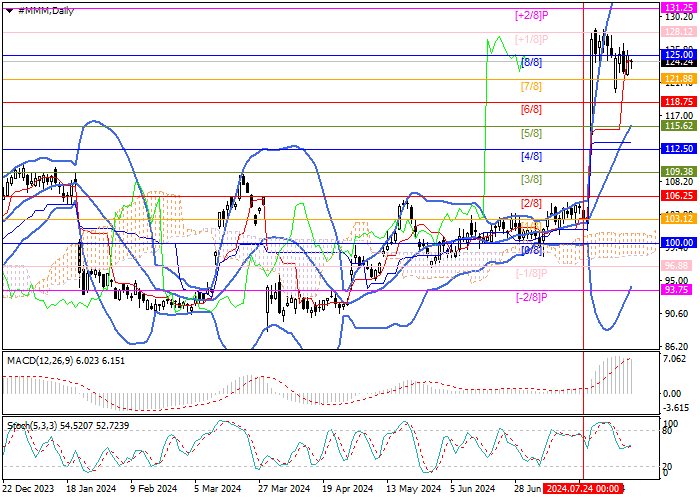
Shares of 3M Co., an American diversified innovative manufacturing company, rose significantly at the end of last month, allowing a changing of the long-term downward trend. The quotes reversed at 103.12 (Murrey level [1/8]) and rose to the upper border of the Murrey trading range of 125.00 (Murrey level [0/8]), consolidation above which will allow them to reach the target of 131.25 (Murrey level [ 2/8]). In case of a breakdown of 115.62 (Murrey level [5/8]), supported by the middle line of Bollinger Bands, the price may return to 106.25 (Murrey level [2/8]) and 100.00 (Murrey level [0/8]).
Technical indicators point to the formation of an upward trend: Bollinger Bands reversed upwards, the MACD histogram is stable in the positive zone, and Stochastic is horizontal.
Support and resistance
Resistance levels: 125.00, 131.25.
Support levels: 115.62, 106.25, 100.00.
Trading tips
Long positions may be opened above 125.00 or when the price reverses upwards at 115.62, with the target at 131.25 and stop losses of 120.00 and 111.00, respectively. Implementation period: 5–7 days.
風險提示:本文所述僅代表作者個人觀點,不代表 Followme 的官方立場。Followme 不對內容的準確性、完整性或可靠性作出任何保證,對於基於該內容所採取的任何行為,不承擔任何責任,除非另有書面明確說明。
 暫無留言。 來發表第一則觀點吧。