


| Scenario | |
|---|---|
| Timeframe | Weekly |
| Recommendation | BUY STOP |
| Entry Point | 228.00 |
| Take Profit | 237.00 |
| Stop Loss | 222.00 |
| Key Levels | 210.00, 223.60, 228.00, 237.00 |
| Alternative scenario | |
|---|---|
| Recommendation | SELL STOP |
| Entry Point | 223.60 |
| Take Profit | 210.00 |
| Stop Loss | 230.00 |
| Key Levels | 210.00, 223.60, 228.00, 237.00 |
Current trend
Shares of Apple Inc., a giant in the development and sale of personal and tablet computers, are moving in an upward trend at 226.00.
It is expected that new iPhone, Apple Watch, and AirPods models will be unveiled on September 10, and will go on sale at the end of the month. First of all, the presentation should touch upon the iPhone 16, which will receive significant improvements in the field of photography and video shooting, including new sensors and improved image processing algorithms. The implementation of the models can support demand for the company's products after unsuccessful results in China, where the indicator changed by –6.5%, much higher than the expected –2.4%.
It also became known about significant changes in the corporate charter of Apple Inc., aimed at increasing transparency in determining key management issues. In particular, the process of selecting candidates for the Board of Directors will now be more open to shareholders, and the voting mechanism itself will be reduced to simply submitting an application for voting.
At the beginning of the month, the Q2 financial report was published. Revenue amounted to 85.8B dollars, better than the forecast of 84.45B dollars and 81.8B dollars in the same period a year earlier. Earnings per share (EPS) reached 1.4 dollars against the expected 1.35 dollars and 1.26 dollars a year earlier.
Support and resistance
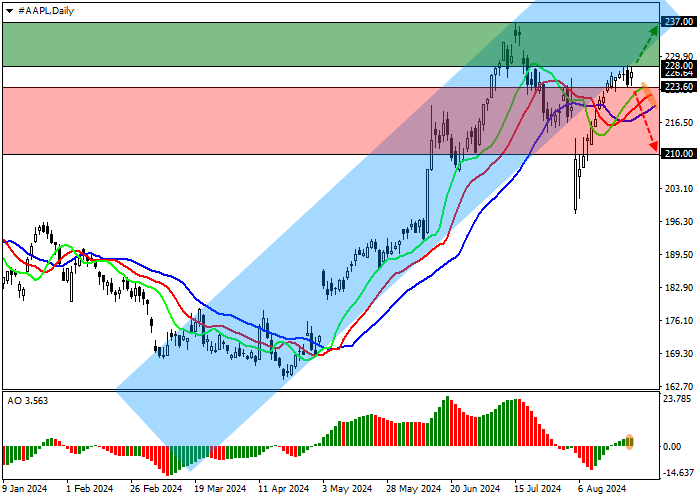
On the daily chart, the trading instrument is moving below the support line of the ascending channel with dynamic boundaries of 237.00–220.00.
Technical indicators are holding the buy signal: the EMA oscillation range of the Alligator indicator is expanding in the direction of growth, and the AO histogram is forming ascending bars above the transition level.
Resistance levels: 228.00, 237.00.
Support levels: 223.60, 210.00.
Trading tips
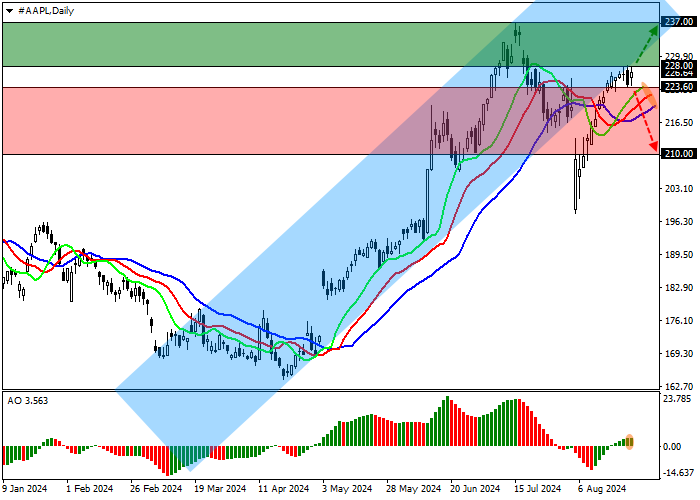
Long positions may be opened after the price rises and consolidates above 228.00, with the target at 237.00. Stop loss is 222.00. Implementation period: 7 days or more.
Short positions may be opened after the price falls and consolidates below 223.60, with the target at 210.00 and stop loss 230.00.
風險提示:本文所述僅代表作者個人觀點,不代表 Followme 的官方立場。Followme 不對內容的準確性、完整性或可靠性作出任何保證,對於基於該內容所採取的任何行為,不承擔任何責任,除非另有書面明確說明。
 暫無留言。 來發表第一則觀點吧。