


PENDLE is a DeFi protocol focused on yield trading, allowing users to both fix or leverage their yield. In today’s blog, we’ll explain the daily Elliott Wave structure taking place and show the potential outcome for the token.
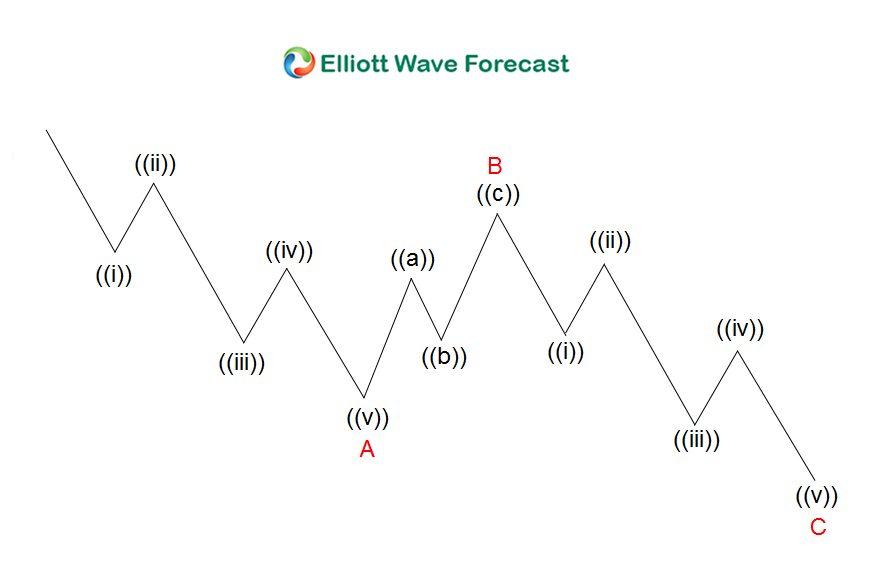
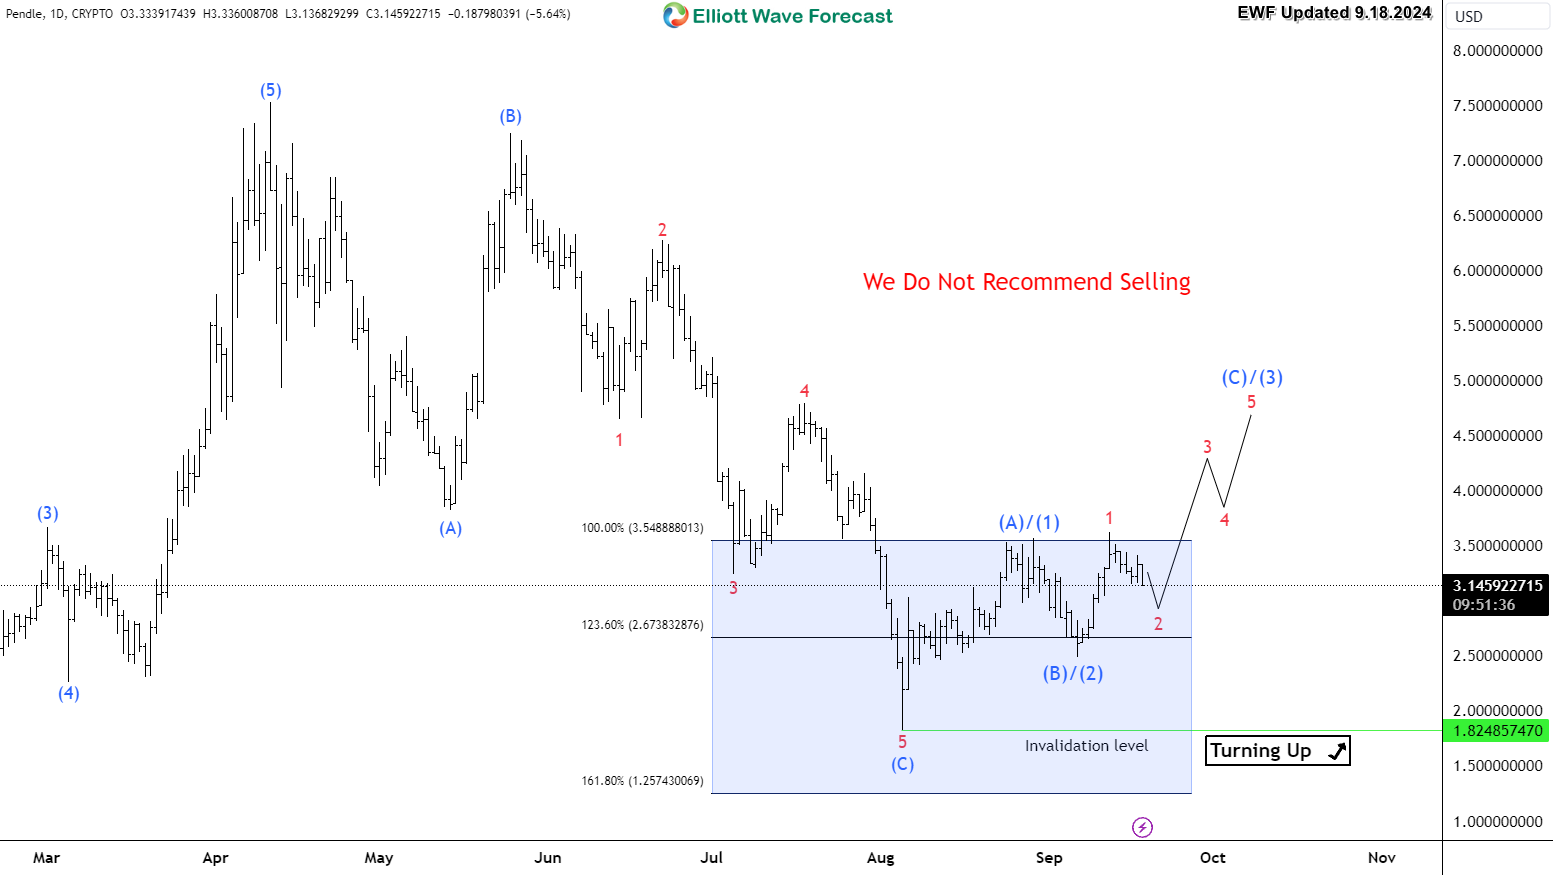
Since April 2024, PENDLE started its correction to the downside and it lost 75% of its value. The move from the peak unfolded within a 3 waves ZigZag structure. This Elliott Wave corrective structure results on a reversal to take place. The token reached the equal legs area at $3.5 – $1.25 from where it ended the daily move to the downside.
The blue box showing in our chart is a technical area where we expect PENDLE to find Buyers and react higher. Up from there, it’s expected to turn to the upside either to start a new 5 waves advance or at least bounce in 3 waves from there.
Elliott Wave ZigZag Structure
PENDLE Daily Chart 9.18.2024
風險提示:本文所述僅代表作者個人觀點,不代表 Followme 的官方立場。Followme 不對內容的準確性、完整性或可靠性作出任何保證,對於基於該內容所採取的任何行為,不承擔任何責任,除非另有書面明確說明。
 暫無留言。 來發表第一則觀點吧。