


| Script | |
|---|---|
| Time frame | Weekly |
| Recommendation | BUY |
| Entry point | 1.3601 |
| Take Profit | 1.3690, 1.3750 |
| Cut loss | 1.3540 |
| Level of importance | 1.2975, 1.3208, 1.3465, 1.3690, 1.3750 |
| Other options | |
|---|---|
| Recommendation | SELL STOP |
| Entry point | 1.3460 |
| Take Profit | 1.3208, 1.2975 |
| Cut loss | 1.3545 |
| Level of importance | 1.2975, 1.3208, 1.3465, 1.3690, 1.3750 |
Price is in correction zone, possibility of increase is maintained.
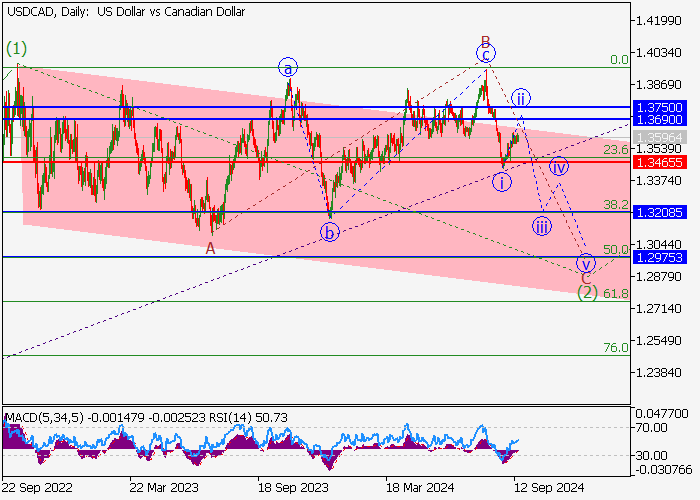
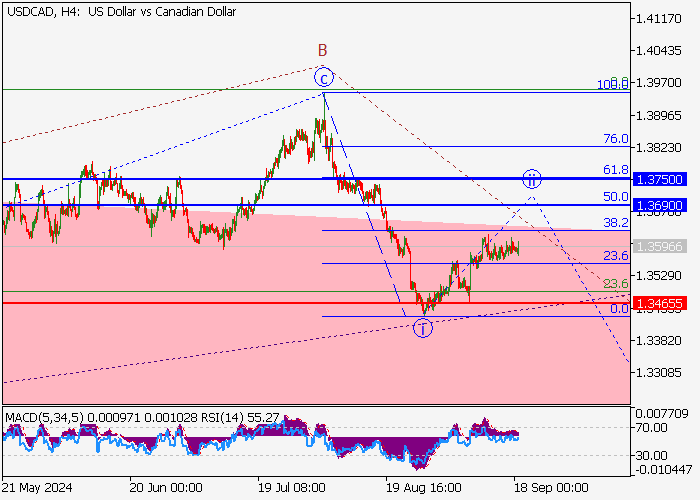
On the daily chart, the first bullish wave of the major level (1) of 5 has formed, and is continuing to develop a correction in the form of the second wave (2) of 5. Currently, wave C of (2) is recorded, which has completed wave i of C and is developing a correction in the form of wave ii of C. If this assessment is correct, the USD/CAD pair will rise to the zone of 1.3690–1.3750. The maximum stop loss for this scenario is 1.3465.
Main script
Consider opening a buy order above 1.3465 with a target to take profit in the 1.3690–1.3750 zone. Timeframe: 7 days or more.
Alternative scenario
The breakout and consolidation of the price below the 1.3465 level allowed the trading instrument to continue the downtrend to the 1.3208–1.2975 zone.
風險提示:本文所述僅代表作者個人觀點,不代表 Followme 的官方立場。Followme 不對內容的準確性、完整性或可靠性作出任何保證,對於基於該內容所採取的任何行為,不承擔任何責任,除非另有書面明確說明。
 暫無留言。 來發表第一則觀點吧。