


| Scenario | |
|---|---|
| Timeframe | Weekly |
| Recommendation | BUY STOP |
| Entry Point | 250.05 |
| Take Profit | 265.62, 281.25 |
| Stop Loss | 239.30 |
| Key Levels | 187.50, 203.12, 218.75, 250.00, 265.62, 281.25 |
| Alternative scenario | |
|---|---|
| Recommendation | SELL STOP |
| Entry Point | 218.70 |
| Take Profit | 203.12, 187.50 |
| Stop Loss | 228.90 |
| Key Levels | 187.50, 203.12, 218.75, 250.00, 265.62, 281.25 |
Current trend
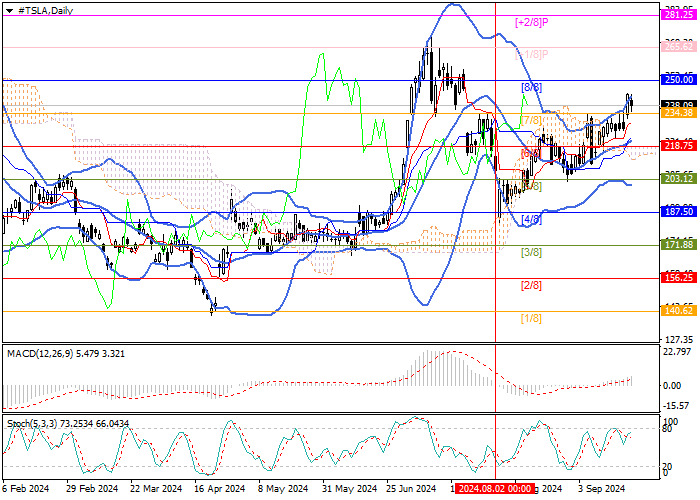
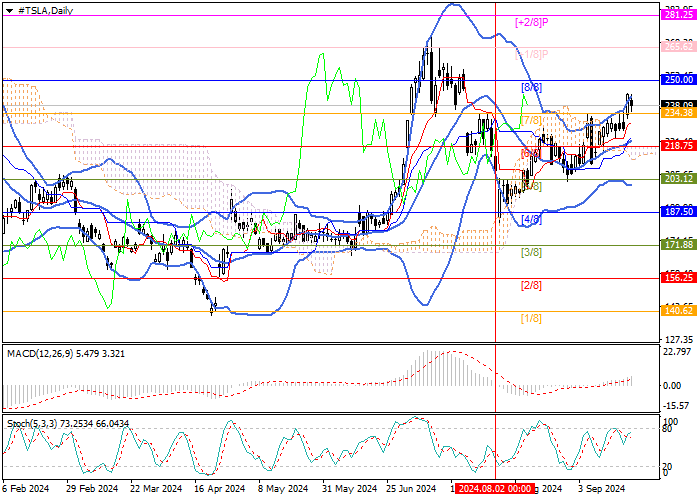
Shares of Tesla Inc., a leading manufacturer of electric cars, are rising within a short-term upward trend. During this time, the price has reversed from the central mark of the main Murrey trading range of 187.50 (Murrey level [4/8]) and is now close to its upper limit of 250.00 (Murrey level [8/8]). Consolidation above will allow the asset to reach the upper reversal zone of 265.62 (Murrey level [ 1/8]) and 281.25 (Murrey level [ 2/8]). In case of consolidation below the reversal mark 218.75 (Murrey level [6/8]), supported by the middle line of Bollinger bands, a decline to the area of 203.12 (Murrey level [5/8]) and 187.50 (Murrey level [4/8]) may follow.
Technical indicators reflect the continuation of the upward trend: Bollinger bands and Stochastic are directed upward, and the MACD histogram is increasing in the positive zone.
Support and resistance
Resistance levels: 250.00, 265.62, 281.25.
Support levels: 218.75, 203.12, 187.50.
Trading tips
Long positions may be opened above 250.00, with the targets of 265.62, 281.25, and stop loss of 239.30. Implementation period: 5–7 days.
Short positions may be opened below 218.75, with the targets of 203.12, 187.50, and stop loss of 228.90.
風險提示:本文所述僅代表作者個人觀點,不代表 Followme 的官方立場。Followme 不對內容的準確性、完整性或可靠性作出任何保證,對於基於該內容所採取的任何行為,不承擔任何責任,除非另有書面明確說明。
 暫無留言。 來發表第一則觀點吧。