


In this technical blog, we will look at the past performance of the Elliott Wave Charts of the DAX index. We presented to members at the elliottwave-forecast. In which, the rally from the 23 October 2023 low ended as an impulse structure. But showed a higher high sequence within the higher time frame charts favored more upside extension to take place. Therefore, we advised members not to sell the index & buy the dips in 3, 7, or 11 swings at the blue box areas. We will explain the structure & forecast below:
DAX 4-Hour Chart From 8.06.2024 Update
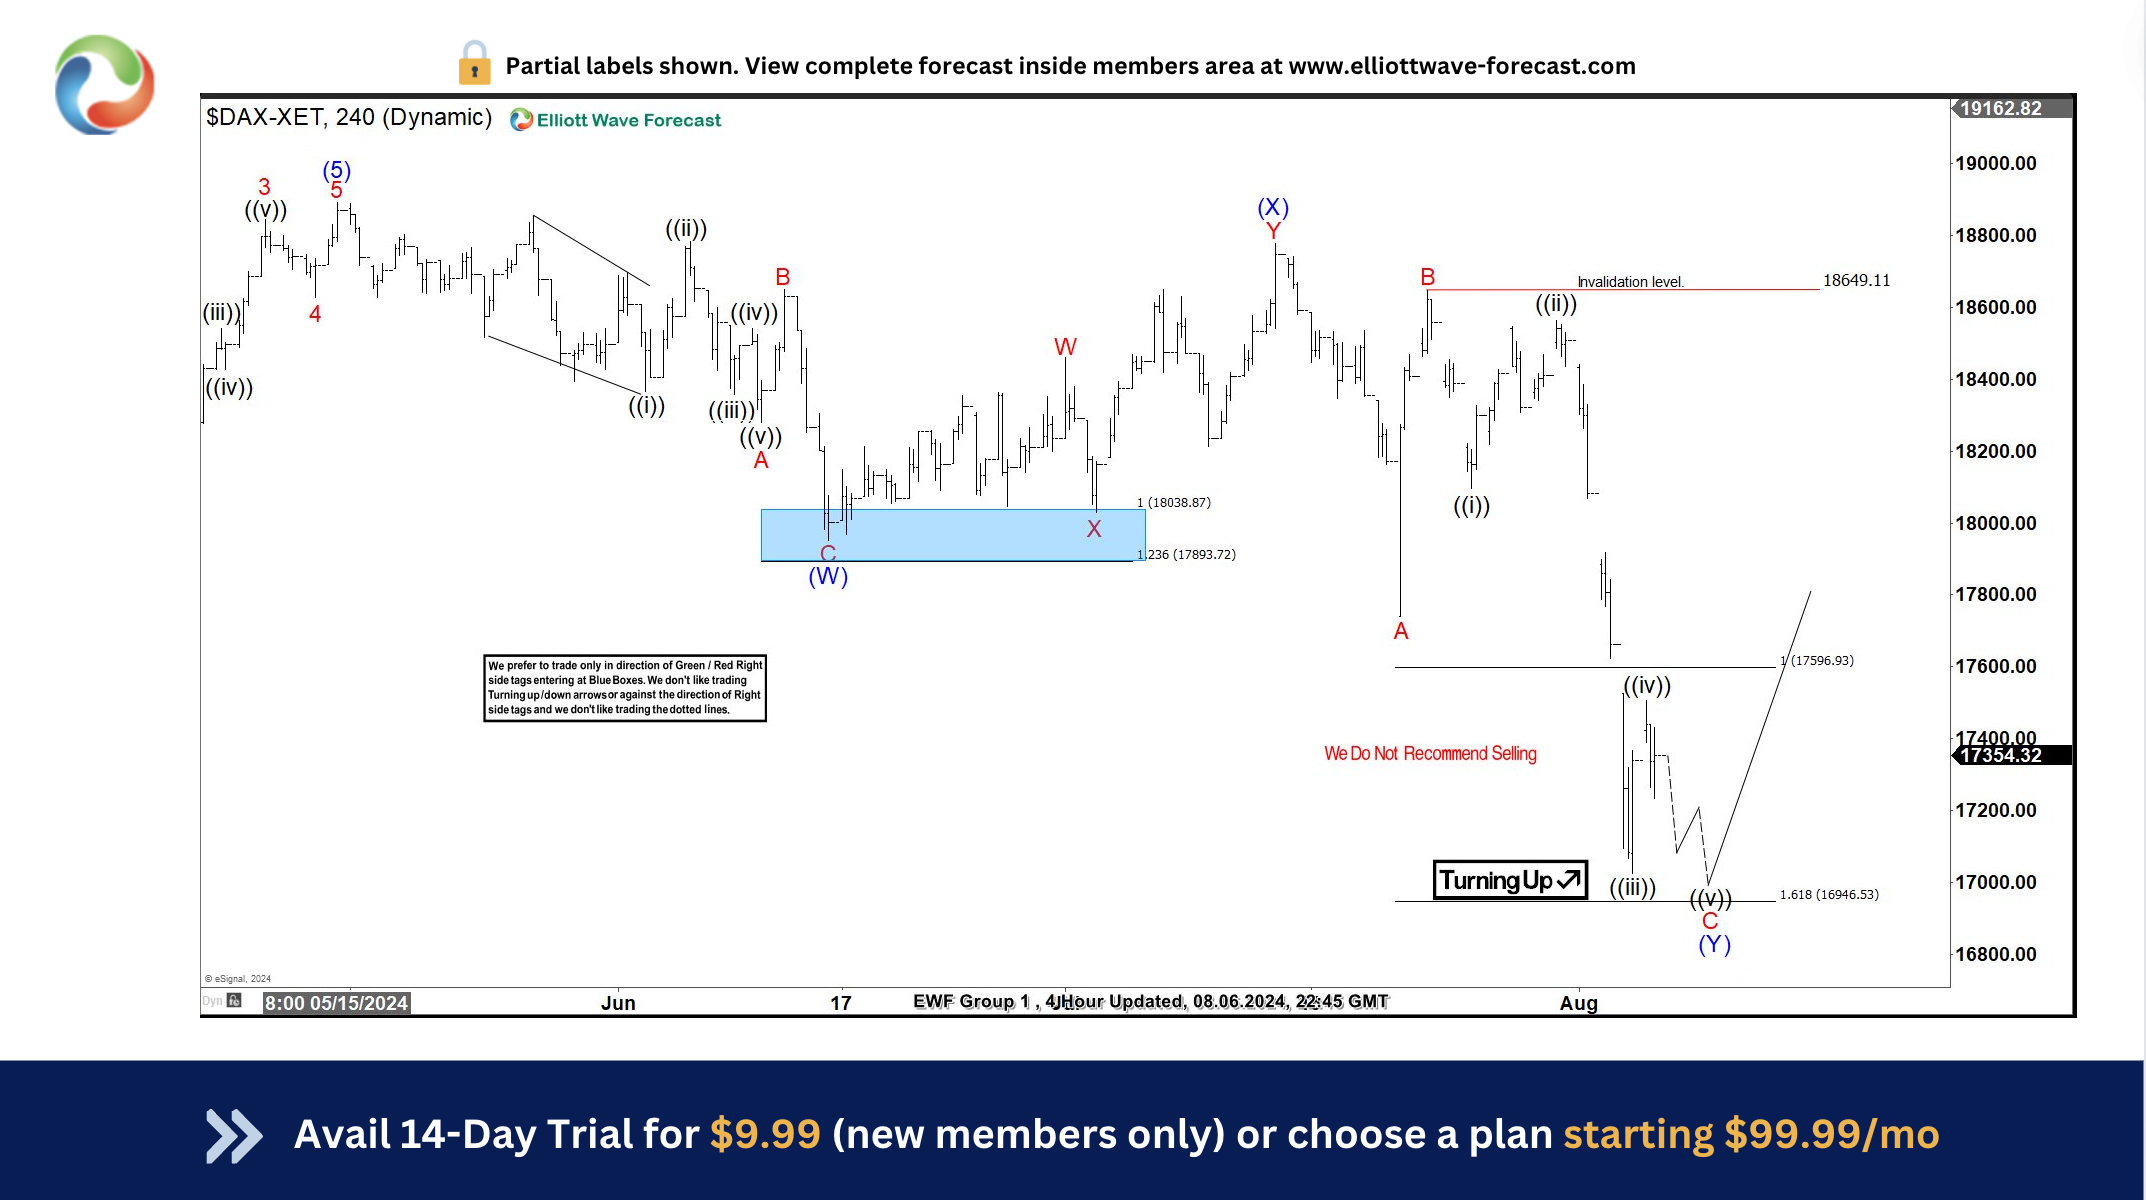
Here’s the 4-hour Elliott wave chart from the 8.06.2024 update. In which, the cycle from the 10/23/2023 low ended as an impulse structure at 18892.92 high. Down from there, the index made a pullback to correct that cycle. The internals of that pullback unfolded as Elliott wave double three structure where wave (W) ended at 17951.17 low. While wave (X) bounce ended at 18779.40 high. Then wave (Y) managed to reach the extreme equal legs area at 17596.93- 16946.53. From there, buyers were expected to appear looking for the next leg higher or for a 3 wave bounce minimum.
DAX Latest 4-Hour Chart From 9.23.2024 Update
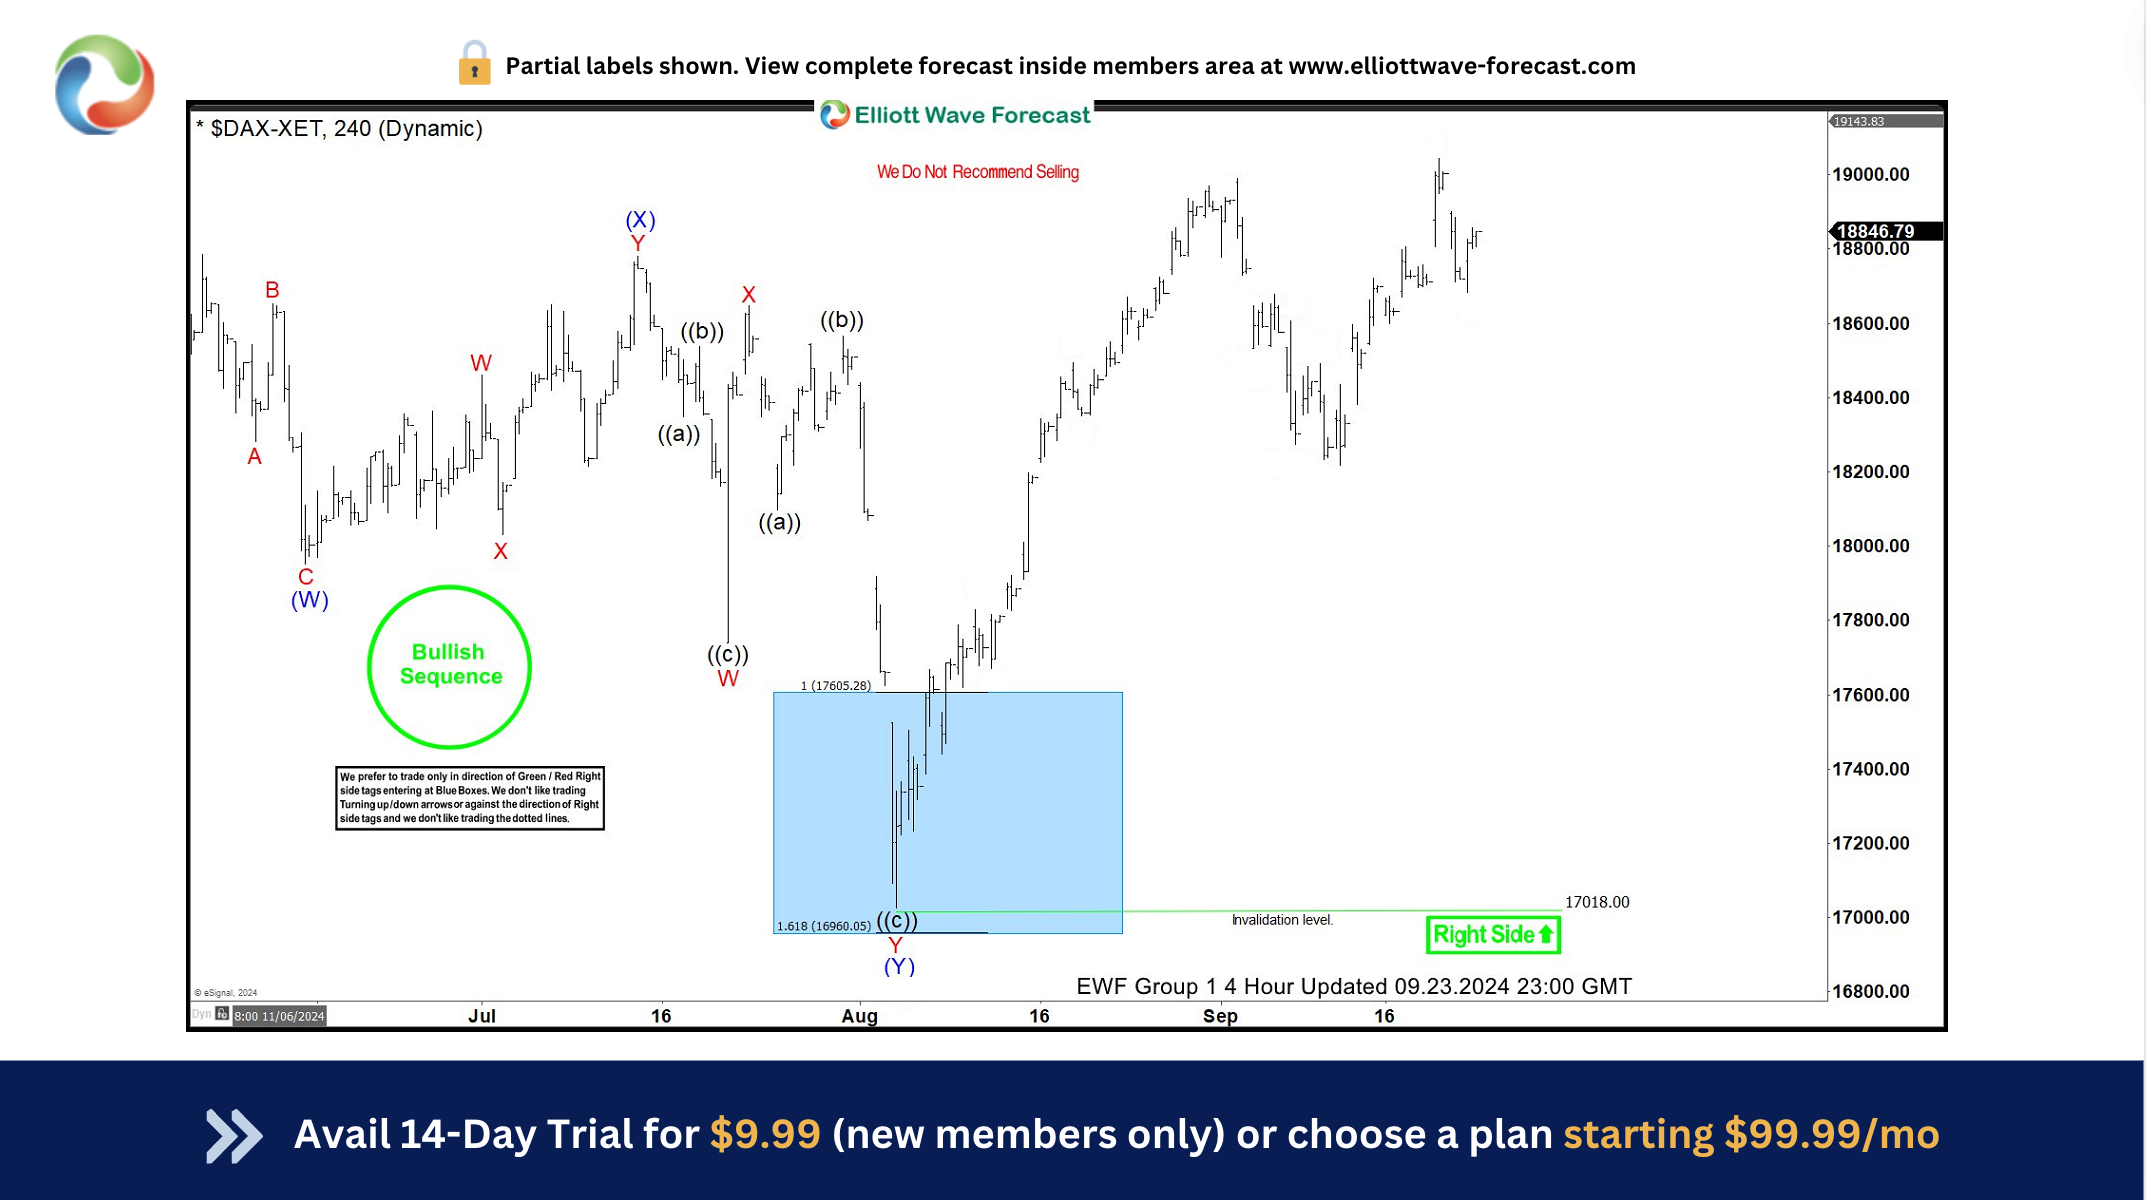
This is the latest 4-hour Elliott wave Chart from the 9.23.2024 update. In which the index shows a reaction higher taking place, right after ending the correction within the extreme area. Allowed members to create a risk-free position shortly after taking the long position at the blue box area. Since then, index has already made a new high above 18892.92 high confirming the next extension higher.
風險提示:本文所述僅代表作者個人觀點,不代表 Followme 的官方立場。Followme 不對內容的準確性、完整性或可靠性作出任何保證,對於基於該內容所採取的任何行為,不承擔任何責任,除非另有書面明確說明。
 暫無留言。 來發表第一則觀點吧。