



| Scenario | |
|---|---|
| Timeframe | Weekly |
| Recommendation | BUY STOP |
| Entry Point | 158.00 |
| Take Profit | 175.00, 187.50 |
| Stop Loss | 150.00 |
| Key Levels | 110.80, 125.00, 137.50, 157.40, 175.00, 187.50 |
| Alternative scenario | |
|---|---|
| Recommendation | SELL STOP |
| Entry Point | 137.00 |
| Take Profit | 125.00, 110.80 |
| Stop Loss | 146.00 |
| Key Levels | 110.80, 125.00, 137.50, 157.40, 175.00, 187.50 |
Current trend
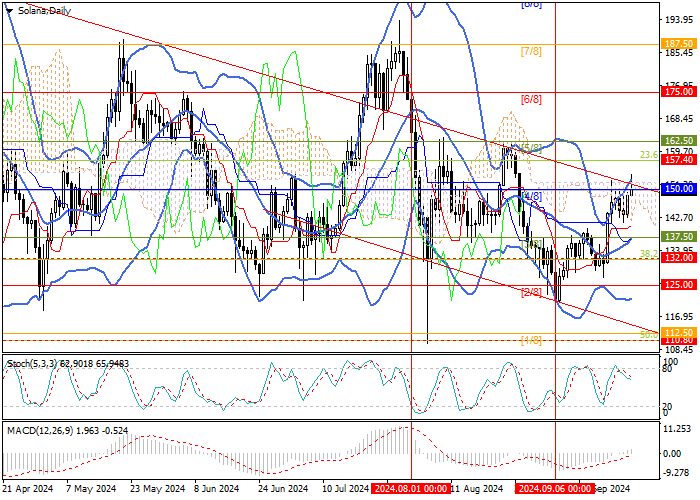
The SOL/USD pair continues to move within the descending channel for the second month in a row: now, quotes have started to grow and are testing its upper limit around the 150.00 mark (Murrey level [4/8]), if fixed above which and the 157.40 mark (23.6% Fibonacci retracement), the movement will continue to the targets of 175.00 (Murrey level [6/8]) and 187.50 (Murrey level [7/8]). The level of 137.50 (Murrey level [3/8]) seems to be the key for the “bears” 137.50 level (Murrey level [3/8]), supported by the central line of Bollinger Bands: its breakdown will allow testing the 125.00 (Murrey level [2/8]) and 110.80 (50.0% Fibonacci retracement) marks.
Technical indicators confirm the formation of a new uptrend on the market: Bollinger Bands are reversing up, MACD is increasing in the positive zone, but Stochastic has reversed down from the overbought zone, not excluding price consolidation in the 150.00 area. The exit of quotes from the medium-term downward channel and the beginning of growth in the near future seems to be a quite probable scenario.
Support and resistance
Resistance levels: 157.40, 175.00, 187.50.
Support levels: 137.50, 125.00, 110.80.
Trading tips
Long positions can be opened above 157.40 with targets at 175.00, 187.50 and a stop-loss at 150.00. Implementation period: 5–7 days.
Short positions can be opened below the 137.50 mark with targets at 125.00, 110.80 and a stop-loss at 146.00.
風險提示:本文所述僅代表作者個人觀點,不代表 Followme 的官方立場。Followme 不對內容的準確性、完整性或可靠性作出任何保證,對於基於該內容所採取的任何行為,不承擔任何責任,除非另有書面明確說明。
 暫無留言。 來發表第一則觀點吧。