


| Scenario | |
|---|---|
| Timeframe | Weekly |
| Recommendation | BUY |
| Entry Point | 1.3387 |
| Take Profit | 1.3700, 1.4200 |
| Stop Loss | 1.3151 |
| Key Levels | 1.2300, 1.2674, 1.3151, 1.3700, 1.4200 |
| Alternative scenario | |
|---|---|
| Recommendation | SELL STOP |
| Entry Point | 1.3150 |
| Take Profit | 1.2674, 1.2300 |
| Stop Loss | 1.3310 |
| Key Levels | 1.2300, 1.2674, 1.3151, 1.3700, 1.4200 |
Growth is possible.
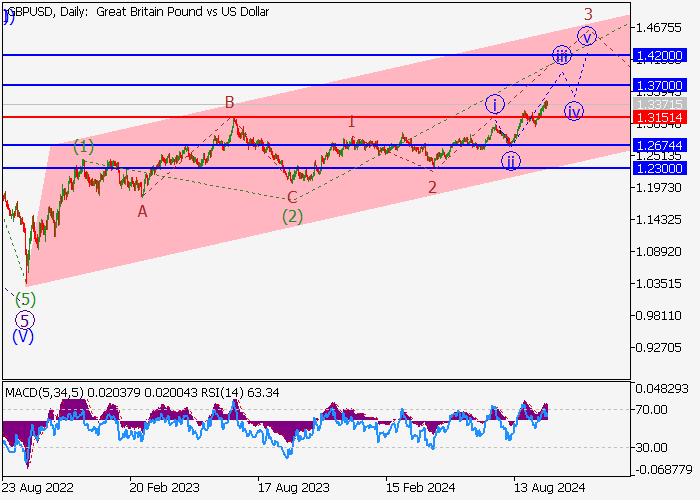
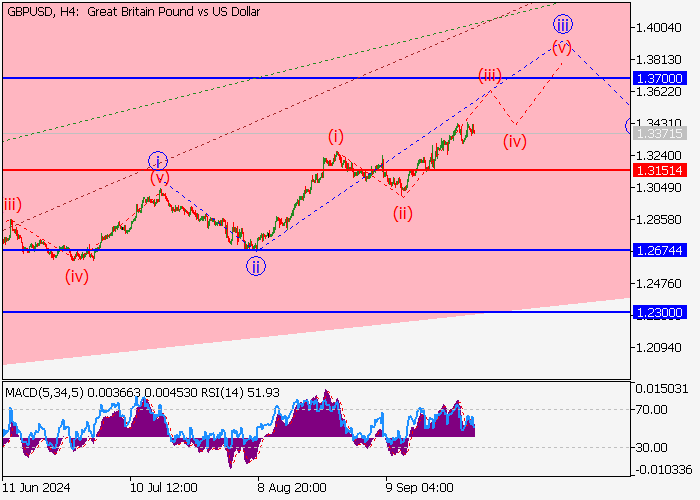
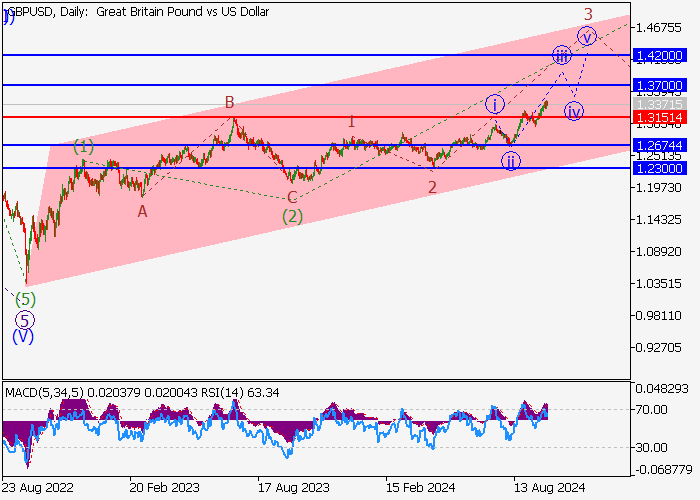
On the daily chart, the third wave of the higher level (3) forms, within which the third wave of the lower level 3 of (3) develops. Now, the wave i of 3 has ended, a correction has ended as the wave ii of 3, and the wave iii of 3 is forming, within which the wave (iii) of iii is developing. If the assumption is correct, the GBP/USD pair will grow to the area of 1.3700–1.4200. In this scenario, critical stop loss level is 1.3151.
Main scenario
Long positions will become relevant above the level of 1.3151 with the targets at 1.3700–1.4200. Implementation period: 7 days and more.
Alternative scenario
A breakout and the consolidation of the price below the level of 1.3151 will let the asset go down to the area of 1.2674–1.2300.
風險提示:本文所述僅代表作者個人觀點,不代表 Followme 的官方立場。Followme 不對內容的準確性、完整性或可靠性作出任何保證,對於基於該內容所採取的任何行為,不承擔任何責任,除非另有書面明確說明。
 暫無留言。 來發表第一則觀點吧。