
| Scenario | |
|---|---|
| Timeframe | Weekly |
| Recommendation | SELL STOP |
| Entry Point | 147.55 |
| Take Profit | 131.25, 125.00 |
| Stop Loss | 155.00 |
| Key Levels | 125.00, 131.25, 147.60, 162.50, 175.00, 185.80 |
| Alternative scenario | |
|---|---|
| Recommendation | BUY STOP |
| Entry Point | 162.55 |
| Take Profit | 175.00, 185.80 |
| Stop Loss | 152.00 |
| Key Levels | 125.00, 131.25, 147.60, 162.50, 175.00, 185.80 |
Current trend
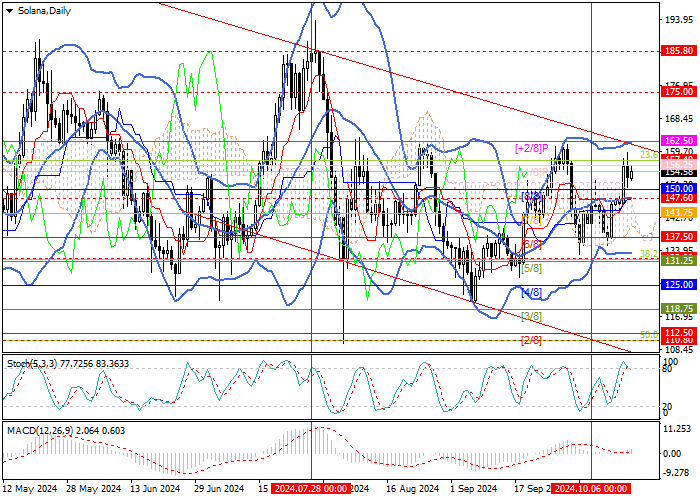
The SOL/USD pair is moving within the medium–term descending channel: this week, quotes again approached its upper limit and tested the key resistance zone of 157.40–162.50 (23.6% Fibonacci retracement–Murrey level [ 2/8]), at the breakout of which the price will leave the descending channel and will be able to continue growing to 175.00 (Murrey level [7/8], W1) and 185.80 (area of July highs). The repeated consolidation of quotes below the central line of Bollinger Bands (147.60) will provide an opportunity to resume downward dynamics towards the targets of 131.25 (Murrey level [5/8], 38.2% Fibonacci retracement) and 125.00 (Murrey level [4/8]).
Technical indicators do not give a clear signal: Bollinger Bands are horizontal, Stochastic is preparing to leave the overbought zone and form a sell signal, and MACD is increasing in the positive zone. While maintaining a long-term downtrend in the SOL/USD pair, the continuation of the decline in quotes in the near future seems to be a more likely scenario.
Support and resistance
Resistance levels: 162.50, 175.00, 185.80.
Support levels: 147.60, 131.25, 125.00.
Trading tips
Short positions should be opened below the 147.60 mark with targets of 131.25, 125.00 and a stop-loss around 155.00. Implementation period: 5–7 days.
Long positions can be opened above the level of 162.50 with targets of 175.00, 185.80 and a stop-loss around 152.00.
風險提示:本文所述僅代表作者個人觀點,不代表 Followme 的官方立場。Followme 不對內容的準確性、完整性或可靠性作出任何保證,對於基於該內容所採取的任何行為,不承擔任何責任,除非另有書面明確說明。

暫無評論,立馬搶沙發