
| Scenario | |
|---|---|
| Timeframe | Weekly |
| Recommendation | SELL STOP |
| Entry Point | 0.5015 |
| Take Profit | 0.4639, 0.4300 |
| Stop Loss | 0.5260 |
| Key Levels | 0.4300, 0.4639, 0.5020, 0.5615, 0.5859, 0.6146, 0.6348 |
| Alternative scenario | |
|---|---|
| Recommendation | BUY STOP |
| Entry Point | 0.5860 |
| Take Profit | 0.6146, 0.6348 |
| Stop Loss | 0.5680 |
| Key Levels | 0.4300, 0.4639, 0.5020, 0.5615, 0.5859, 0.6146, 0.6348 |
Current trend
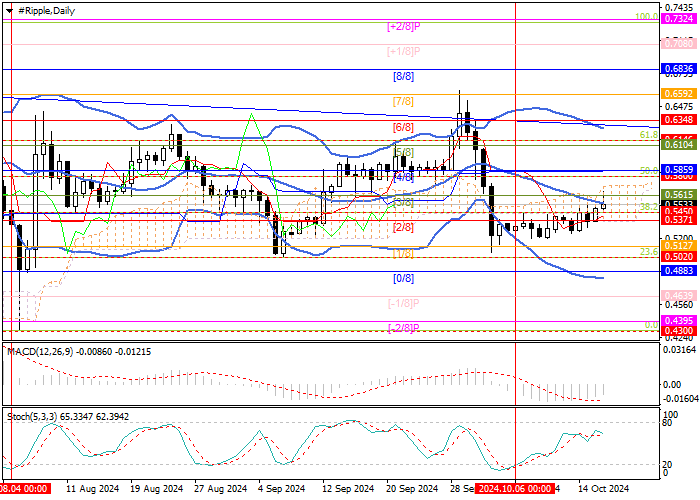
The XRP/USD pair is moving within the medium-term sideways range of 0.6348–0.5020 (Murrey level [5/8], Fibonacci correction 23.6%). At the beginning of the month, the price dropped to its lower border amid a probable slowdown in the rate cuts by the US Fed. However, over the past two weeks, the quotes have been trying to resume growth and regain lost ground. Currently, the asset is testing the middle line of Bollinger Bands 0.5615 (Murrey level [3/8]). Consolidation above will allow it to grow to 0.5859 (Murrey level [4/8]), 0.6146 (Fibonacci correction 61.8%), and 0.6348 (Murrey level [6/8]). After consolidation below the border of the sideways range of 0.5020 (Fibonacci correction 23.6%), the price may reach 0.4639 (Murrey level [–1/8]) and the July low of 0.4300.
Technical indicators maintain a sell signal: Bollinger Bands and Stochastic are reversing downwards, and the MACD histogram is decreasing in the negative zone. The long-term downward trend continues, increasing the likelihood of a further decline.
Support and resistance
Resistance levels: 0.5615, 0.5859, 0.6146, 0.6348.
Support levels: 0.5020, 0.4639, 0.4300.
Trading tips
Short positions may be opened below 0.5020, with the targets at 0.4639, 0.4300, and stop loss 0.5260. Implementation period: 5–7 days.
Long positions may be opened when the price consolidates above 0.5859, with the targets at 0.6146, 0.6348, and stop loss 0.5680.
風險提示:本文所述僅代表作者個人觀點,不代表 Followme 的官方立場。Followme 不對內容的準確性、完整性或可靠性作出任何保證,對於基於該內容所採取的任何行為,不承擔任何責任,除非另有書面明確說明。

暫無評論,立馬搶沙發