| Scenario | |
|---|---|
| Timeframe | Weekly |
| Recommendation | BUY STOP |
| Entry Point | 44.35 |
| Take Profit | 45.31, 46.88 |
| Stop Loss | 43.60 |
| Key Levels | 40.62, 41.41, 42.97, 45.31, 46.88 |
| Alternative scenario | |
|---|---|
| Recommendation | SELL STOP |
| Entry Point | 42.95 |
| Take Profit | 41.41, 40.62 |
| Stop Loss | 43.45 |
| Key Levels | 40.62, 41.41, 42.97, 45.31, 46.88 |
Current trend
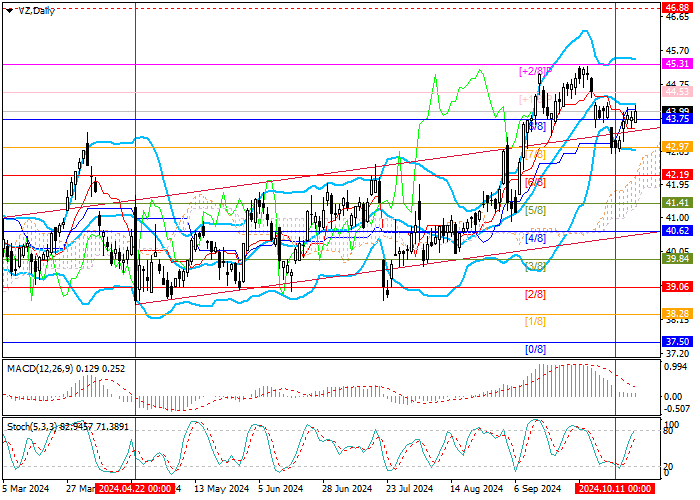
Shares of Verizon Communications Inc., one of the largest American telecommunications companies, are trading within a long-term upward trend. After completing a short-term correction, they reversed from 42.97 (Murrey level [7/8]). After the asset consolidates above the upper border of the main Murrey trading range 43.75 (Murrey level [8/8]), it may reach the area of 45.31 (Murrey level [ 2/8]) and 46.88 (Murrey level [ 2/8], W1). After a breakdown of the lower line of Bollinger Bands 42.97 (Murrey level [7/8]), a decline to the area of 41.41 (Murrey level [5/8]) and 40.62 (Murrey level [4/8]) is likely.
Technical indicators do not give a single signal: Bollinger Bands are reversing downwards, and Stochastic is reversing upwards. The MACD histogram is at the zero line, its volumes are insignificant.
Support and resistance
Resistance levels: 45.31, 46.88.
Support levels: 42.97, 41.41, 40.62.

Trading tips
Long positions may be opened from 44.30, with the targets of 45.31, 46.88, and stop loss of 43.60. Implementation period: 5–7 days.
Short positions may be opened below 42.97, with the targets at 41.41, 40.62, and stop loss 43.45.
風險提示:本文所述僅代表作者個人觀點,不代表 Followme 的官方立場。Followme 不對內容的準確性、完整性或可靠性作出任何保證,對於基於該內容所採取的任何行為,不承擔任何責任,除非另有書面明確說明。

暫無評論,立馬搶沙發