General Electric (GE) is a high-tech industrial company founded in 1892 through the merger of Thomas Edison's Edison General Electric Company and Thomson-Houston Electric Company. GE operates through several key segments, including aerospace, renewable energy, and power. The company designs and produces commercial and military aircraft engines, renewable energy generation equipment, and various power generation systems. In this article and video, we will look at the Elliott Wave technical outlook for the company which will soon present an opportunity to buy the dips.
General Electric (GE) Monthly Elliott Wave Chart
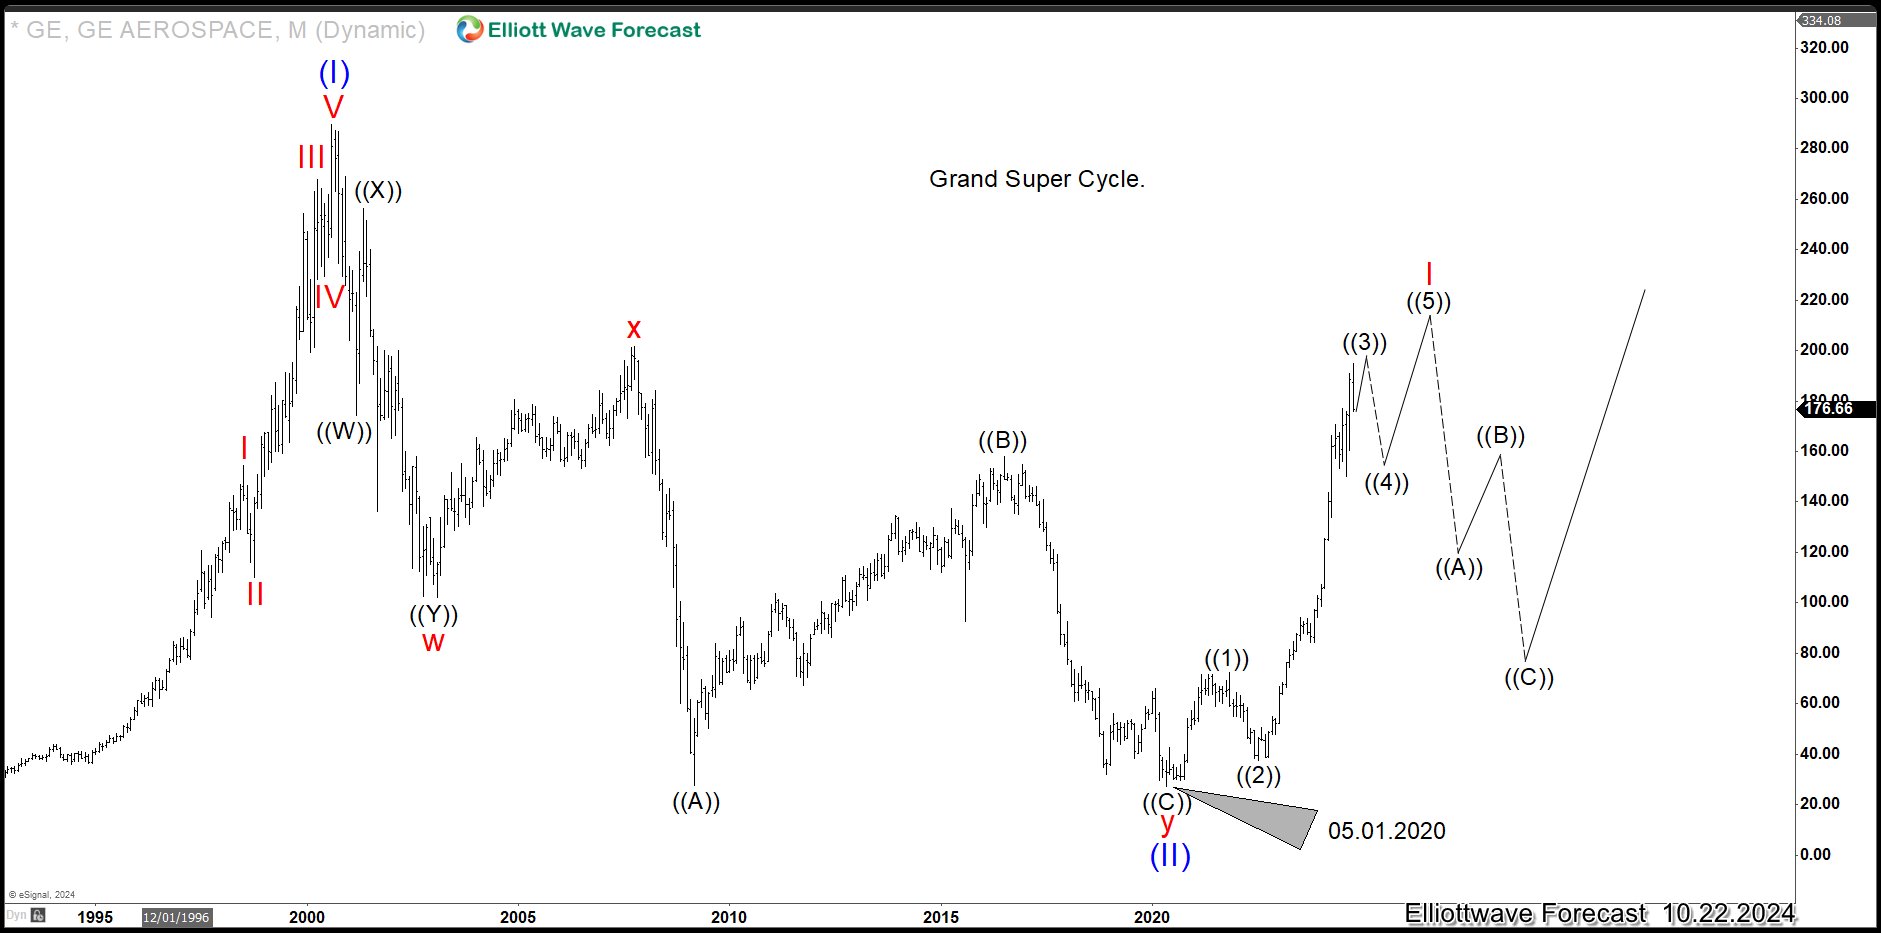
Monthly Elliott Wave View in General Electric (GE) above shows a very nice 7 swing structure pullback. The correction ended at 27.28 on 5.1.2020 low as wave (II). The stock then rallies higher from there in wave (III). Internal subdivision of the rally unfolds as a 5 waves impulse Elliott Wave structure. Up from wave (II), wave ((1)) ended at 72.29 and pullback in wave ((2)) ended at 37.30. The stock has extended higher in wave ((3)) with clear separation (extension). Expect wave ((3)) to end soon and the stock to pullback in wave ((4)) which should give a buying opportunity in 3, 7, or 11 swing.
General Electric Weekly Elliott Wave Chart
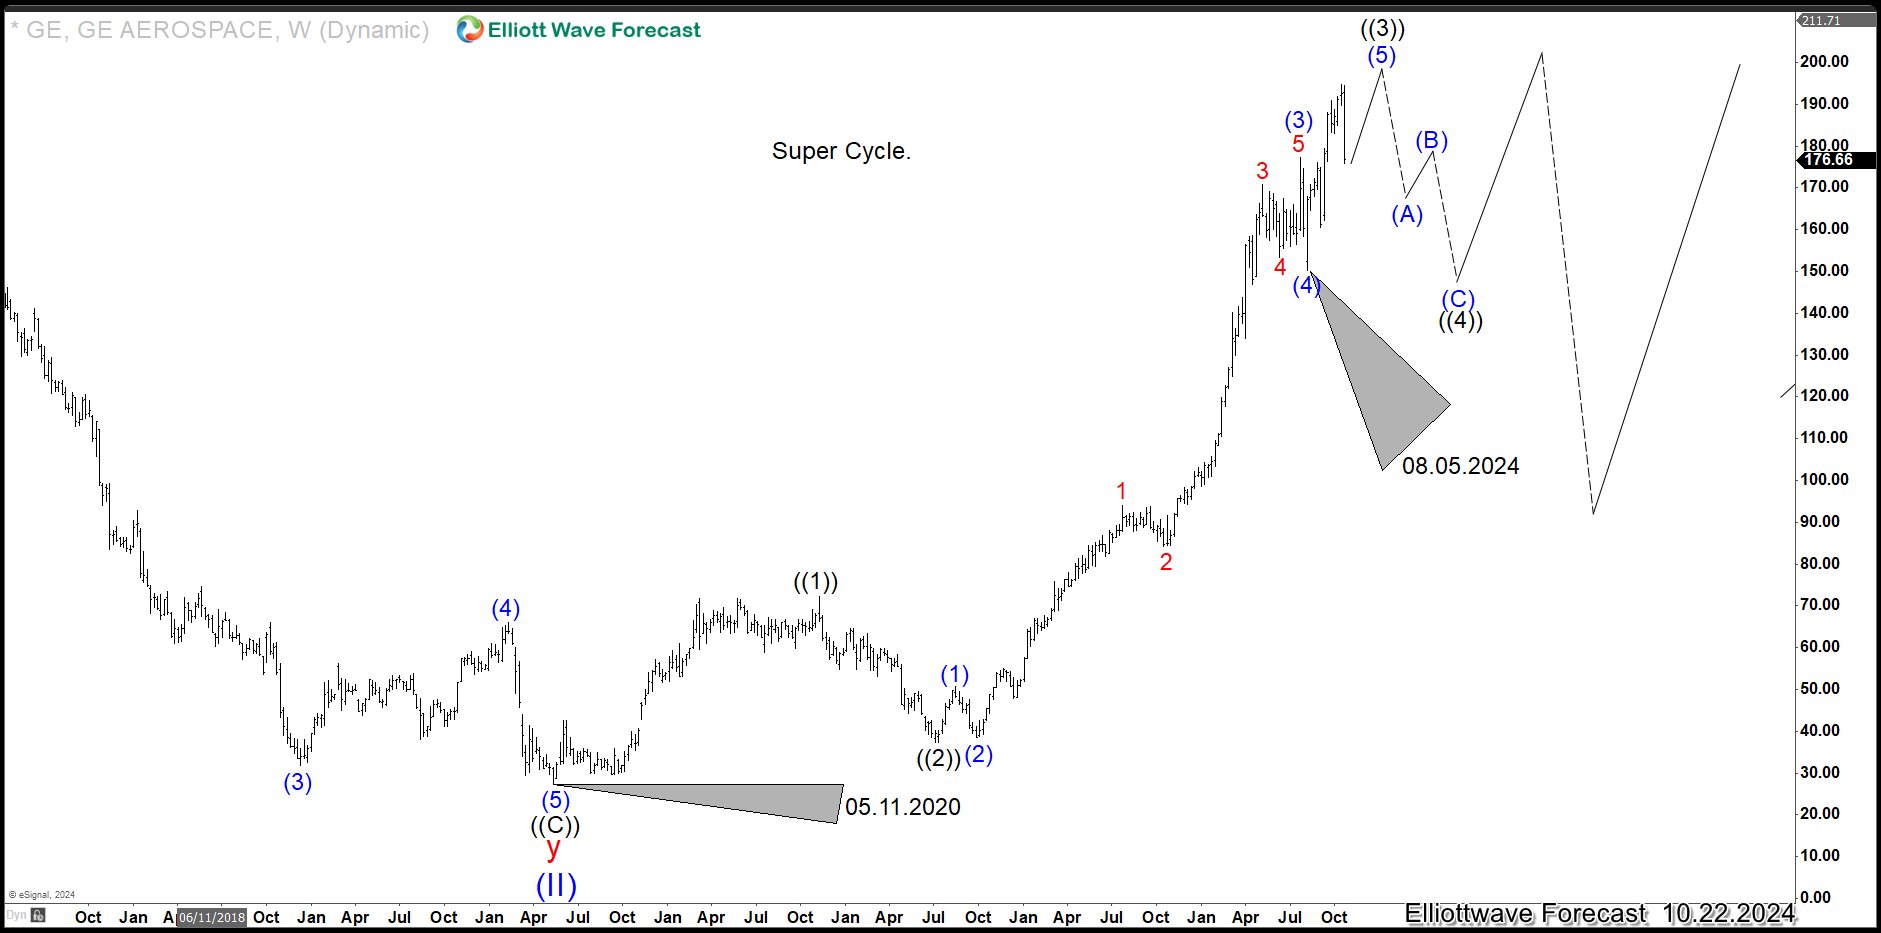
Weekly Elliott Wave View on General Electric (GE) above shows that the rally from 5.11.2020 low is in progress as an impulse. Up from there, wave ((1)) ended at 72.29 and wave ((2)) pullback ended at 37.30. The stock has either ended wave ((3)) or expected to end wave ((3)) soon. Either way, a pullback in wave ((4)) is near. The pullback should unfold in 3, 7, or 11 swing before the next leg higher.
General Electric 4 Hour Elliott Wave Chart
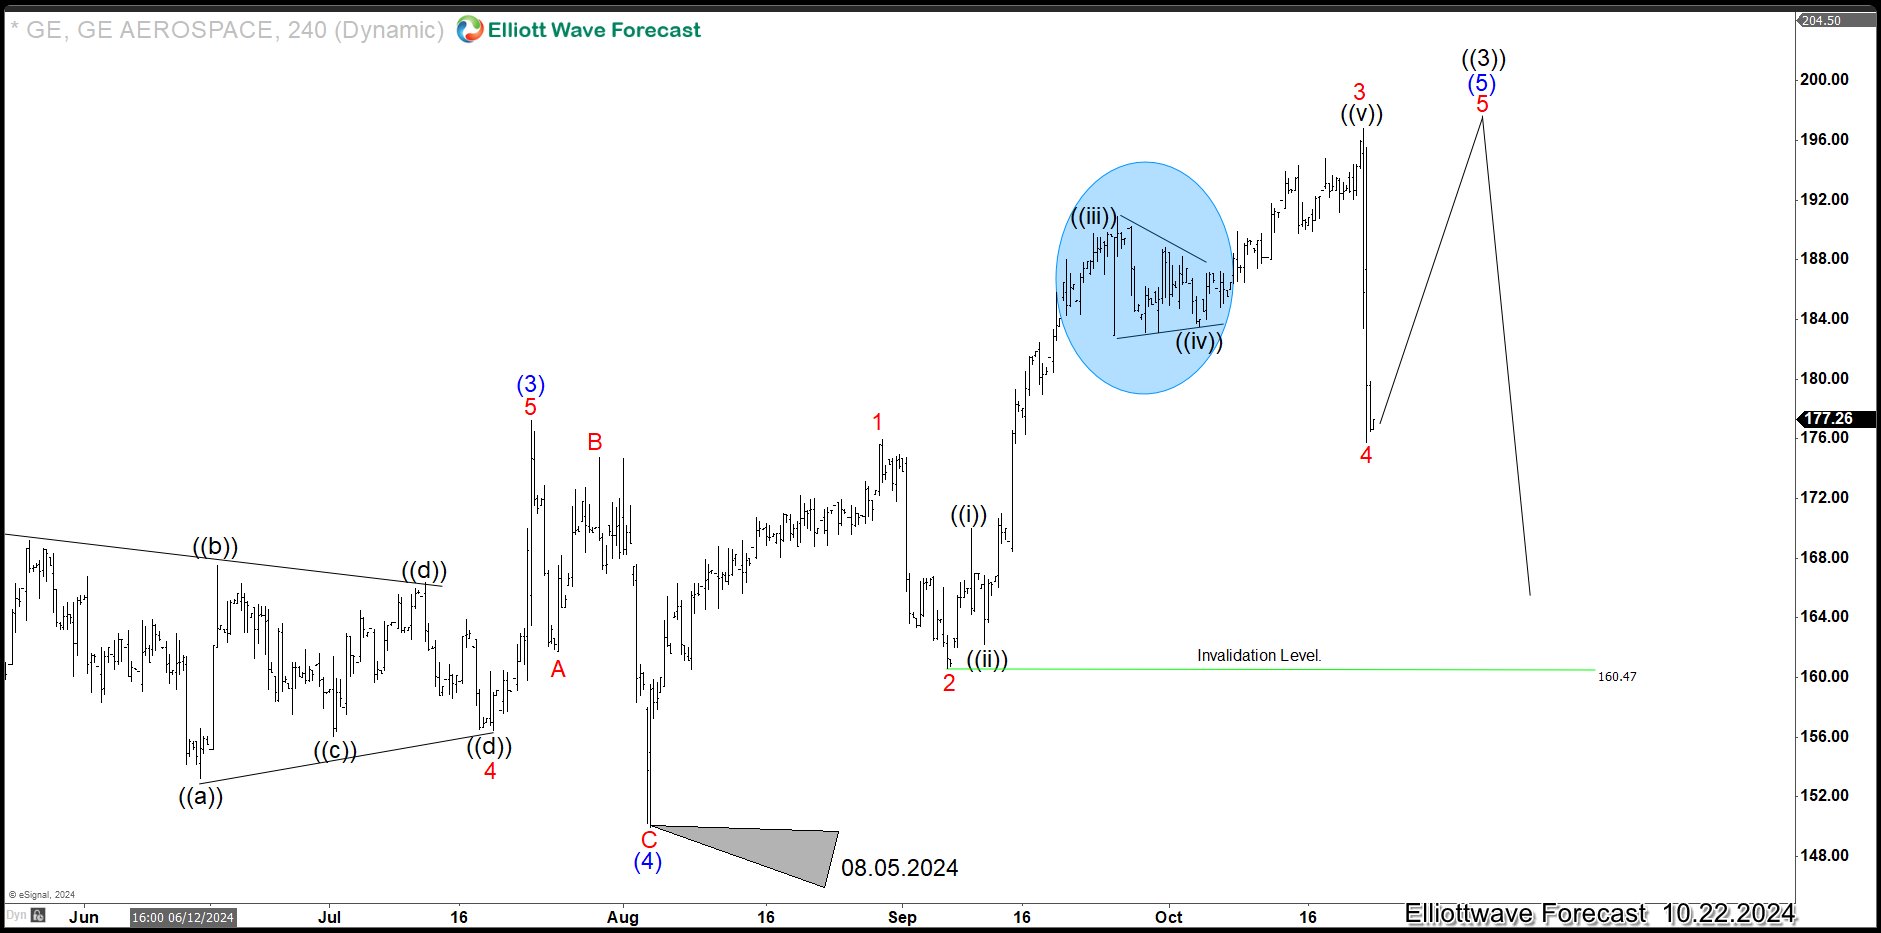
4 Hour Chart of General Electric (GE) above shows that the stock is close to ending wave 5 of (5) of ((3)). It either rallies 1 more leg to complete wave ((3)) or wave ((3)) has already ended at the last peak (196.77). Expect pullback in wave ((4)) to happen anytime to correct cycle from July 4, 2022 low. Pullback should unfold in 3, 7, or 11 swing before the next leg higher.
風險提示:本文所述僅代表作者個人觀點,不代表 Followme 的官方立場。Followme 不對內容的準確性、完整性或可靠性作出任何保證,對於基於該內容所採取的任何行為,不承擔任何責任,除非另有書面明確說明。

暫無評論,立馬搶沙發