
| Scenario | |
|---|---|
| Time frame | Weekly |
| Recommendation | SELL |
| Entry point | 1.2915 |
| Take Profit | 1.2722, 1.2560 |
| Stop Loss | 1.3051 |
| The most important levels | 1.2560, 1.2722, 1.3051, 1.3621, 1.3894 |
| Alternative scenario | |
|---|---|
| Recommendation | BUY STOP |
| Entry point | 1.3055 |
| Take Profit | 1.3621, 1.3894 |
| Stop Loss | 1.2865 |
| The most important levels | 1.2560, 1.2722, 1.3051, 1.3621, 1.3894 |
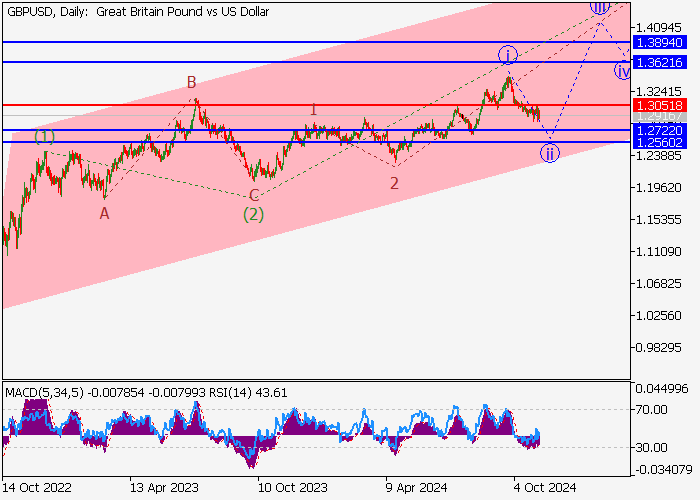
Price correction continues, probability of decline still exists.
On the daily chart, the third wave of the older level (3) is continuing, within which the third wave of the younger level (3) of 3 is developing. At the moment, wave i of 3 has ended and the correction in the form of wave ii of 3 is developing, within which wave (c) of ii began. If the assumption is correct, the EUR/USD pair will fall to the level of 1.2722–1.2560. The critical stop-loss for this scenario is the level of 1.3051.
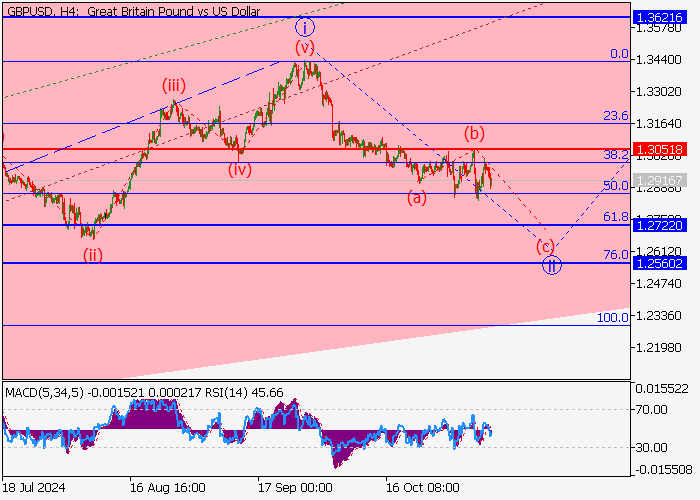
Basic scenario
Short positions are current below 1.3051 with targets 1.2722–1.2560. Deadline: 7 days and more.
Alternative scenario
A price breakout and stop above the 1.3051 level will enable the trading instrument to continue its upward momentum to the 1.3621–1.3894 level.
風險提示:本文所述僅代表作者個人觀點,不代表 Followme 的官方立場。Followme 不對內容的準確性、完整性或可靠性作出任何保證,對於基於該內容所採取的任何行為,不承擔任何責任,除非另有書面明確說明。

暫無評論,立馬搶沙發