· 閱讀量 262
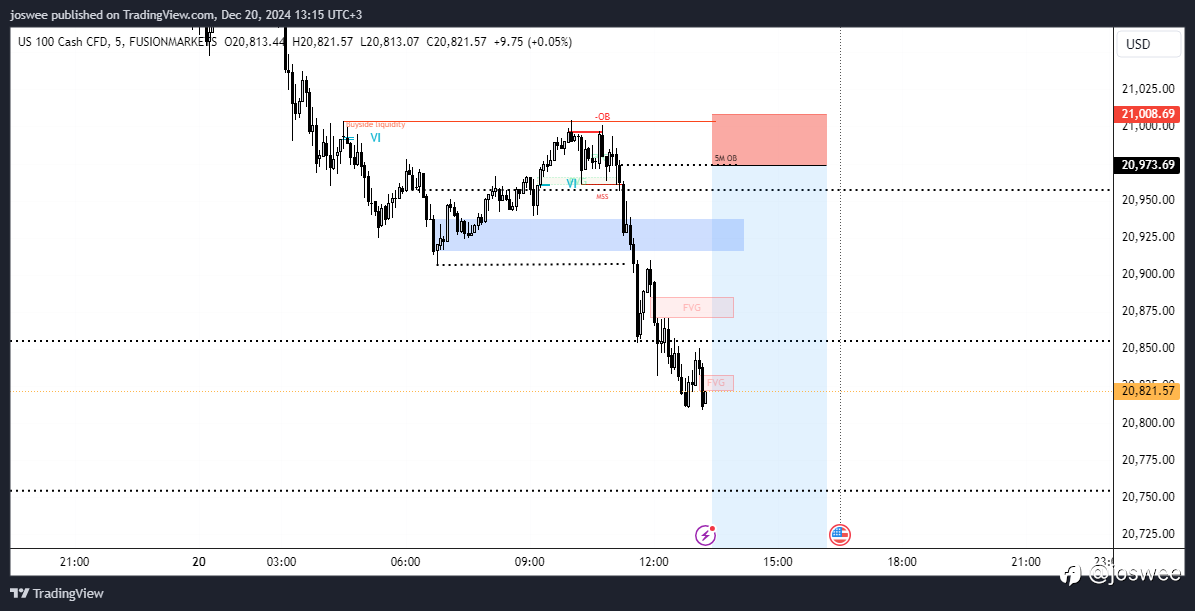
Market Analysis Using Smart Money Concepts
Overview
- Asset: US 100 Cash CFD
- Timeframe: 5-minute chart
Current Market Structure
- Trend: The market is exhibiting a clear downtrend characterized by lower highs and lower lows, indicating that sellers are in control.
Key Levels
- Order Blocks (OB)
- Daily OB: Located near the top of the chart, this area represents institutional interest for potential buying. Watch for price action around this zone as it may indicate a reversal.
- 5-Minute OB: Close to the current price action, this order block is essential for identifying short-term buying opportunities if the price retraces.
- Fair Value Gaps (FVG)
- There are two identified FVGs:
- FVG at the lower levels: This gap may act as support as price pulls back, providing a potential area for price discovery.
- FVG in the middle range: This may attract price back to fill where there was a fast movement away from, offering more trading opportunities.
- Liquidity Areas
- Upside Liquidity: The marked area indicates potential targets where price may seek liquidity, likely above resistance levels.
- Observing where buy orders (liquidity) are accumulated can provide insights for potential reversals or continuations.
Entry and Exit Points
- Buy Entry: Consider entering long positions if price approaches the 5-minute OB and shows signs of reversal (e.g., bullish candlestick formations).
- Sell Entry: Look to enter shorts if price fails to hold above the daily OB and begins to show bearish momentum.
- Targets: Set profit targets at FVG levels and structural highs/lows,
風險提示:本文所述僅代表作者個人觀點,不代表 Followme 的官方立場。Followme 不對內容的準確性、完整性或可靠性作出任何保證,對於基於該內容所採取的任何行為,不承擔任何責任,除非另有書面明確說明。
喜歡的話,讚賞支持一下

暫無評論,立馬搶沙發