


The Elliott Wave analysis for Lululemon Athletica (NASDAQ: LULU) provides a detailed examination of its ongoing corrective structure within a larger five-wave impulsive sequence.
Daily Elliott Wave Counts:
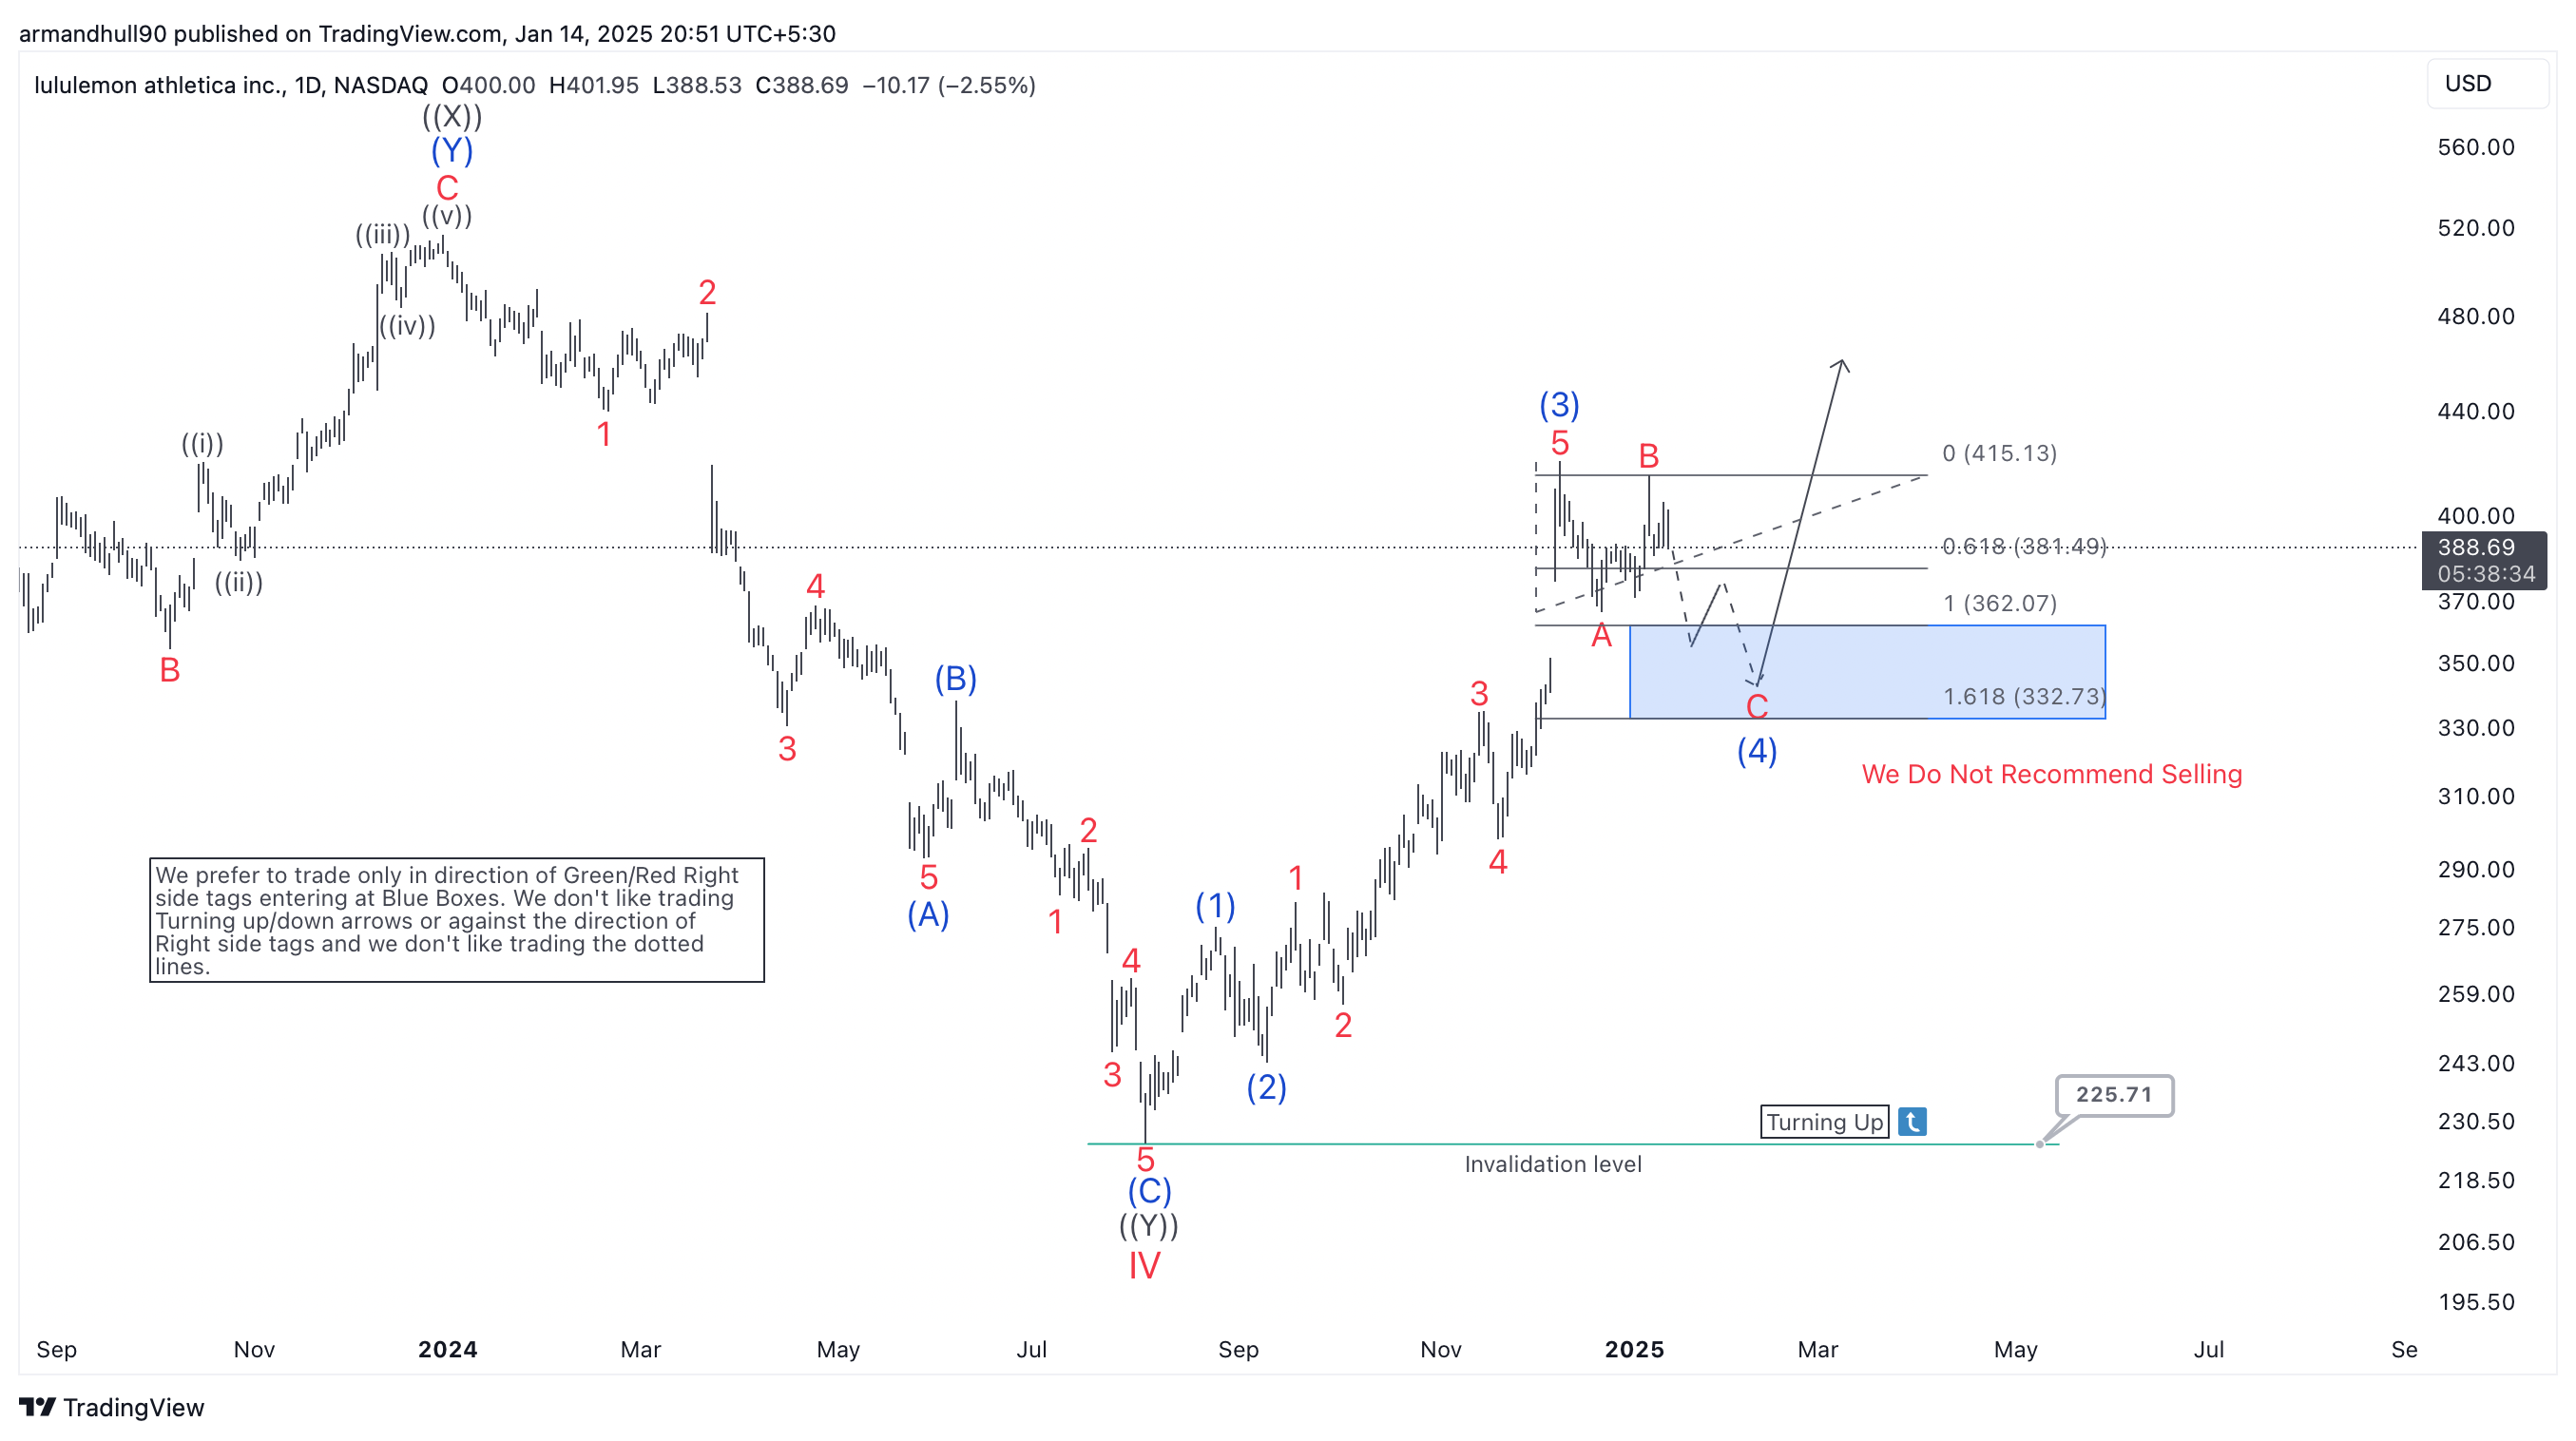
On the daily chart, the stock remains in wave (4), a corrective phase within a larger impulsive trend. Wave (4) appears to follow an ABC zigzag pattern. Wave A has already ended as a five-wave decline. Meanwhile, wave B is still developing. It might take the form of a flat or expanded flat correction with three distinct waves.
Once wave B completes, wave C is likely to move downward. It could reach the Fibonacci extension zone between 1.0 ($361.72) and 1.618 ($332.38). This area corresponds with the "blue box," a key high-probability reversal zone. The blue box signals where wave (4) might end, offering a potential entry for the bullish wave (5). The invalidation level is positioned below $225.71, ensuring a clear boundary for risk management.
Hourly Counts: Short-term Outlook
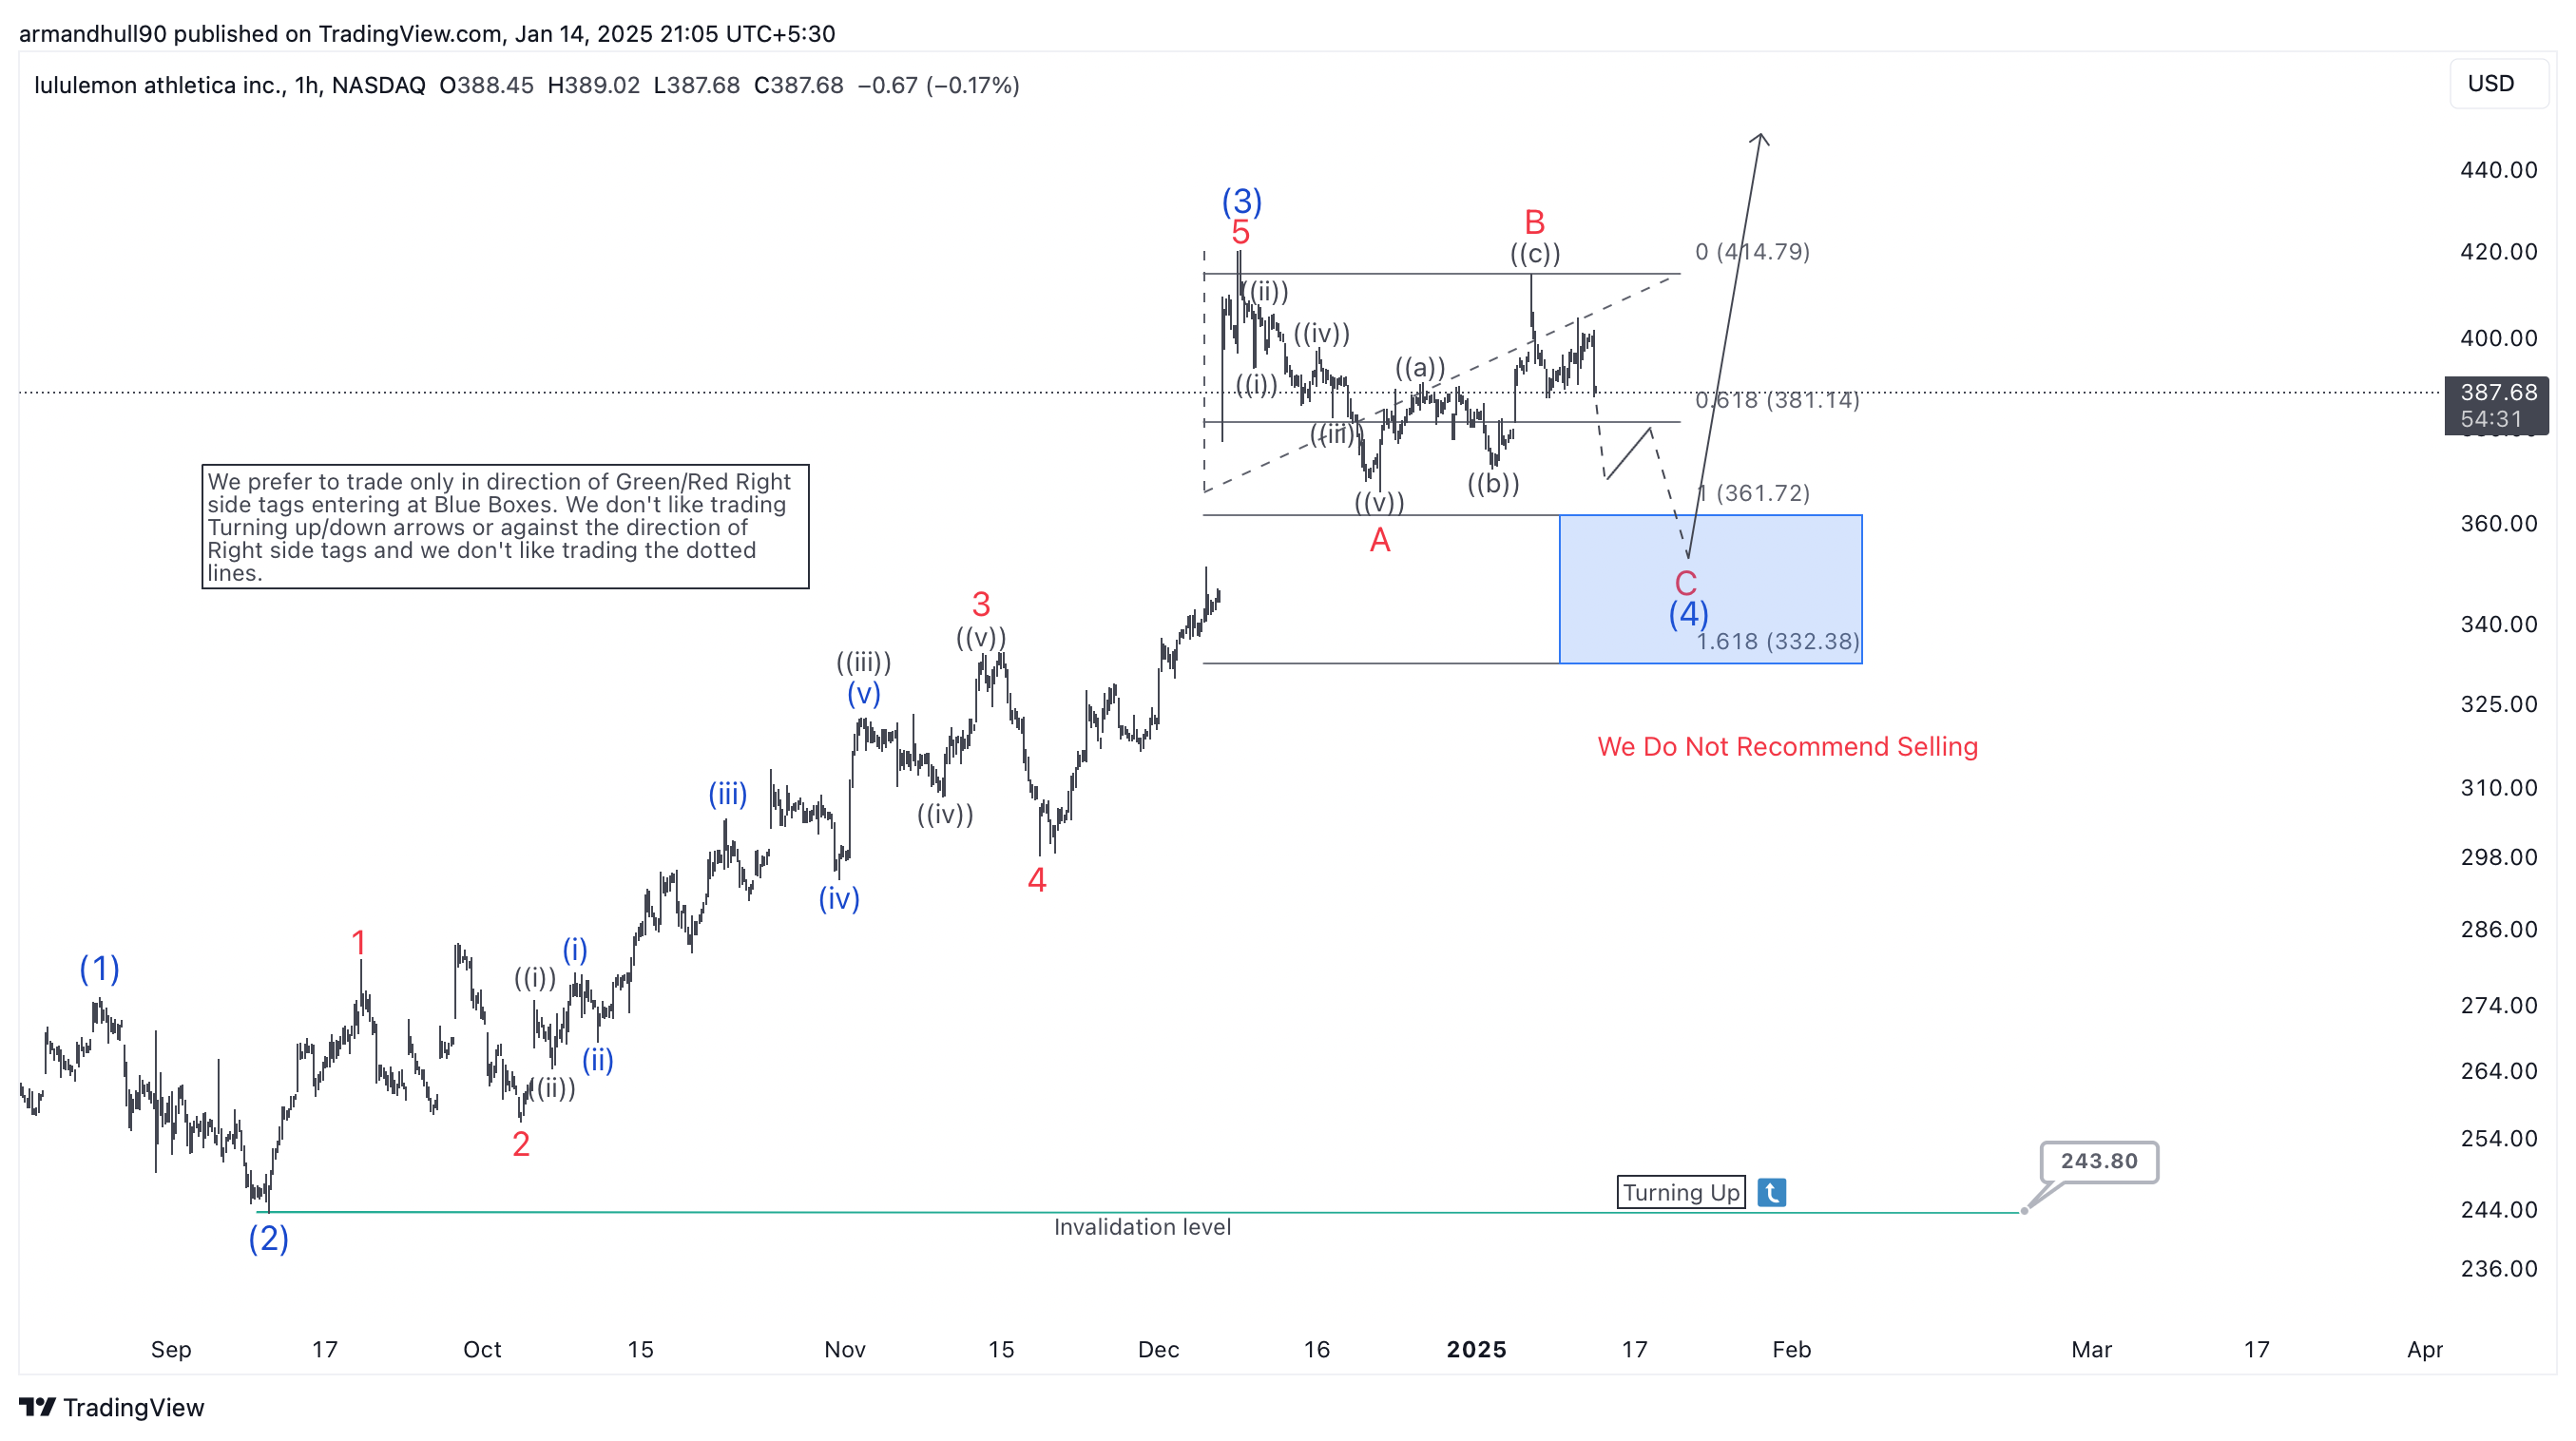
On the hourly chart, wave (4) reveals crucial details, especially the structure of wave B. This wave is developing as a complex correction, likely a flat or double zigzag. Wave A already ended with a clear five-wave decline. Meanwhile, wave B is unfolding in a three-wave corrective pattern.Next, wave C is expected to complete as a five-wave decline. It will likely reach the blue box between $361.72 and $332.38. This area acts as a strong support zone and provides a high-probability reversal point. If the price reverses here, wave (5) could begin. This upward move may surpass the wave (3) high of $415.13, offering significant bullish potential.
Moreover, the analysis highlights the importance of trading in the direction of green right-side tags. These tags indicate favorable trends. Traders should avoid speculative positions, such as shorting in the blue box or relying on dotted-line projections. When wave (5) materialises as expected, it will likely confirm the Elliott Wave analysis and unlock further upside potential.
風險提示:本文所述僅代表作者個人觀點,不代表 Followme 的官方立場。Followme 不對內容的準確性、完整性或可靠性作出任何保證,對於基於該內容所採取的任何行為,不承擔任何責任,除非另有書面明確說明。
 暫無留言。 來發表第一則觀點吧。