


Oklo Inc (NYSE: OKLO) is rewriting the rules of the energy sector. While traditional utilities struggle with aging infrastructure, this nuclear innovator has delivered 300%+ gains since April 2025 - turning skeptics into believers. The sector hasn't seen this level of disruptive potential since the early days of solar. Today, we break down OKLO’s Elliott Wave structure, key targets, and why bulls remain in control.
Elliott Wave Analysis
OKLO's explosive rally since April has decisively breached February's $59.14 peak (Wave I), confirming a strong 3-wave advance in motion. The current impulse shows Wave ((1)) peaking at $73.55, Wave ((2)) bottoming at $50.08, and Wave ((3)) now extends higher. This incomplete bullish sequence forms part of a larger nesting structure within Wave III - typically the strongest and most extended phase in Elliott Wave theory.
OKLO Daily Chart
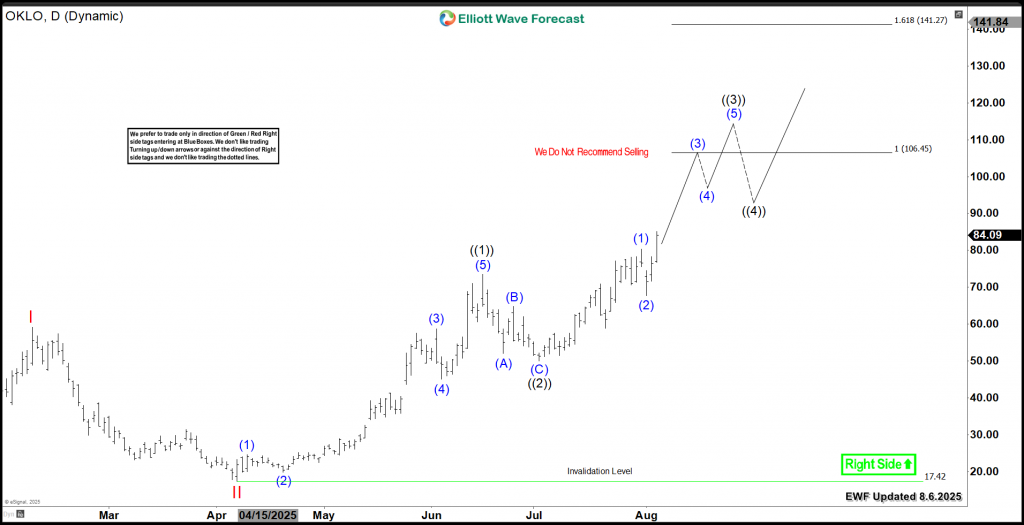
OKLO's daily cycle analysis from April 2025 lows reveals a textbook Elliott Wave progression. Subsequently, the stock now surges through Wave ((3)) and our projections confirm an equal legs target between $106-$141, with multiple technical factors supporting this outlook.
Conclusion
The bullish sequence formed by OKLO will support the stock through the upcoming short term corrections, creating opportunities to buy daily and weekly pullbacks using our Elliott Wave strategy. Consequently, the ideal approach is to enter positions once the stock completes a 3, 7, or 11 swing corrective sequence during pullbacks. Moreover, our extreme Blue Box system enhances precision, allowing traders to identify optimal entry points with clarity and confidence.
風險提示:本文所述僅代表作者個人觀點,不代表 Followme 的官方立場。Followme 不對內容的準確性、完整性或可靠性作出任何保證,對於基於該內容所採取的任何行為,不承擔任何責任,除非另有書面明確說明。
 暫無留言。 來發表第一則觀點吧。