


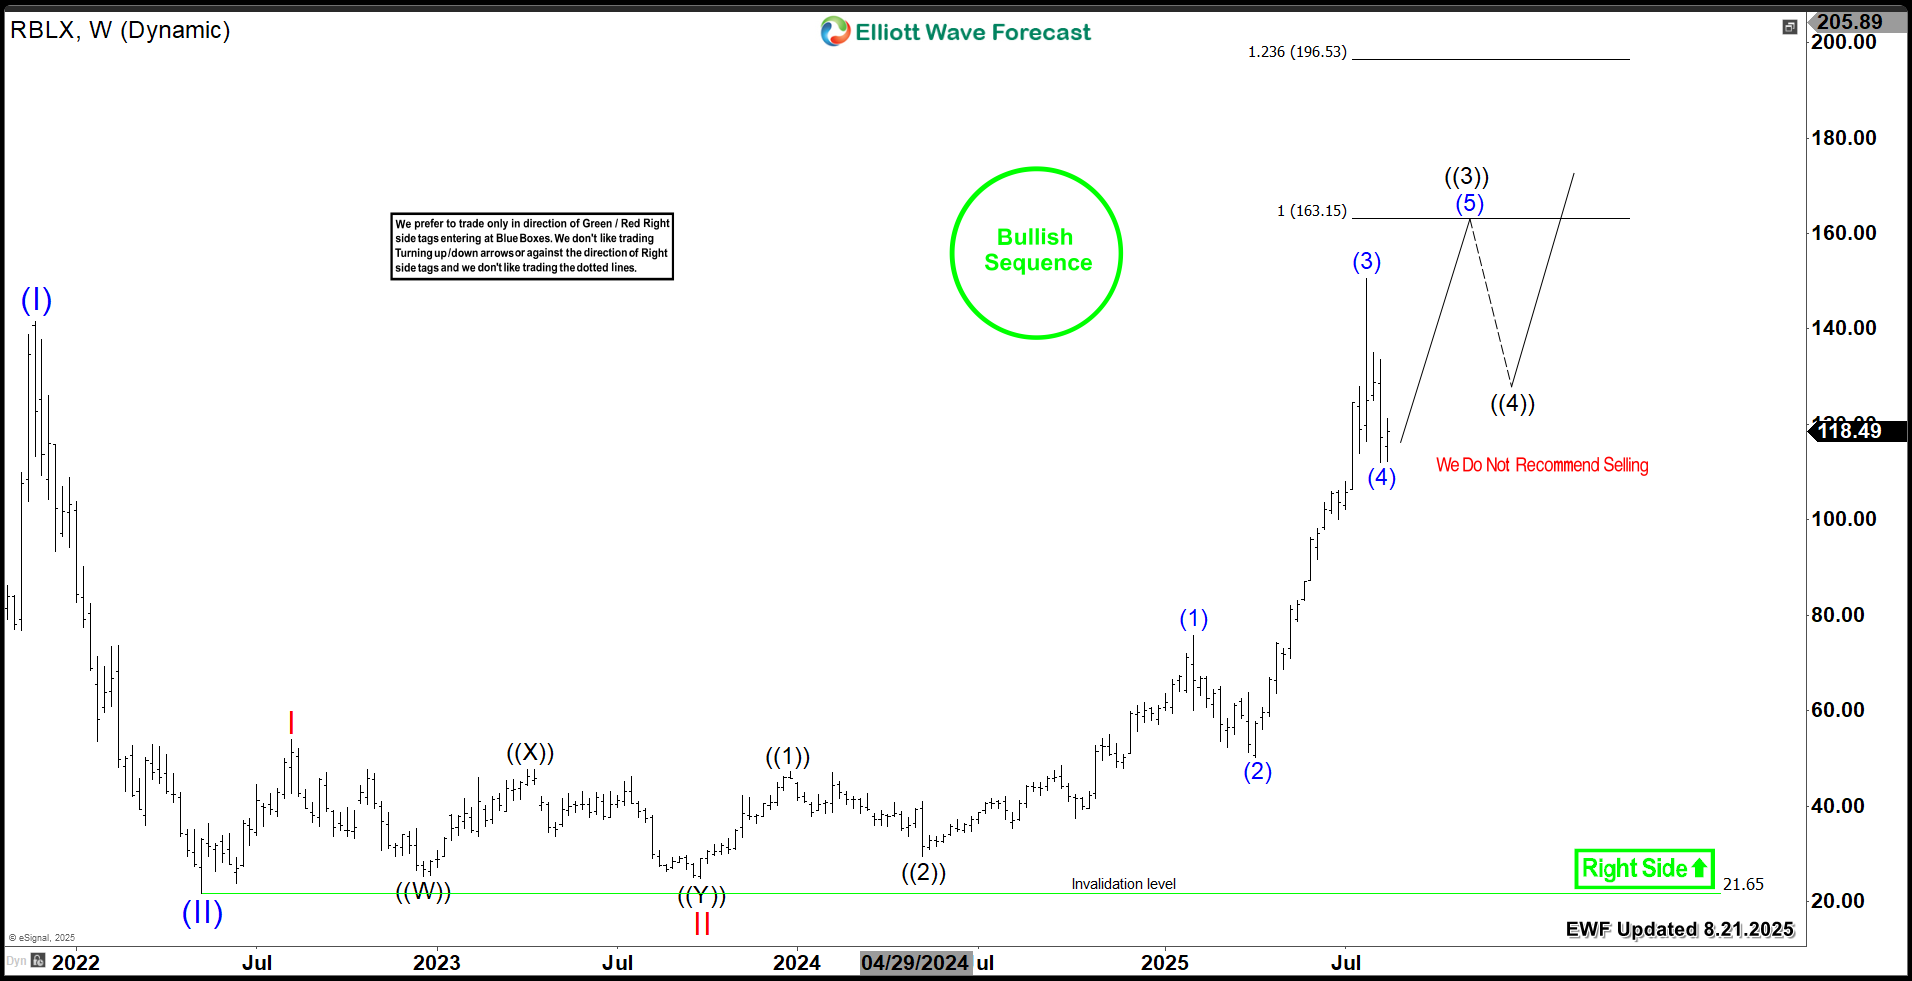
Roblox (NYSE: RBLX) soared 595% from its 2022 lows, firmly establishing itself as a top-performing stock. Previously, we identified a bullish nesting structure originating from the $21.65 low. Now, with RBLX breaking to fresh all-time highs, we examine the ongoing Elliott Wave pattern. Subsequently, this analysis outlines the expected next targets and key levels to watch.
Roblox Elliott Wave Analysis
RBLX's explosive rally since the 2022 low has decisively breached its 2021 peak of $141.60. Consequently, the stock has established a strong weekly bullish sequence. This pattern now targets the $163 - $196 equal legs area. Furthermore, the nesting structure from the lows propelled prices to new all-time highs within Wave (3). This phase is typically the strongest and most extended in Elliott Wave theory. As the chart below shows, the impulsive sequence remains active. Currently, Wave (4) is unfolding as a correction. Ultimately, this pullback should yield next rally in Wave (5). This will complete Wave ((3)) within the projected target zone. Following this rally, another pullback in wave ((4)) will occur. This creates a final buying opportunity before wave ((5)) of III begins.
Roblox RBLX Weekly Chart
Conclusion
RBLX's bullish sequence will support the stock through all upcoming pullbacks. Consequently, this creates strategic opportunities to enter during daily corrections. Traders should ideally position themselves after a 3, 7, or 11-swing corrective pattern completes. Then, anticipate extensions toward new highs. Moreover, our proprietary Blue Box system sharpens entry precision. Ultimately, this offers clarity and confidence for timing optimal trade setups.
風險提示:本文所述僅代表作者個人觀點,不代表 Followme 的官方立場。Followme 不對內容的準確性、完整性或可靠性作出任何保證,對於基於該內容所採取的任何行為,不承擔任何責任,除非另有書面明確說明。
 暫無留言。 來發表第一則觀點吧。