


Newmont Corporation (NEM), based in Denver, Colorado, is the world’s largest gold mining company. It operates across multiple continents with key mines like Brucejack and Penasquito. Listed on the S&P 500, it also produces copper, silver, zinc, and lead, employing around 42,600 people. This article looks at the Elliott Wave Outlook for the stock.
Newmont Monthly Elliott Wave Chart
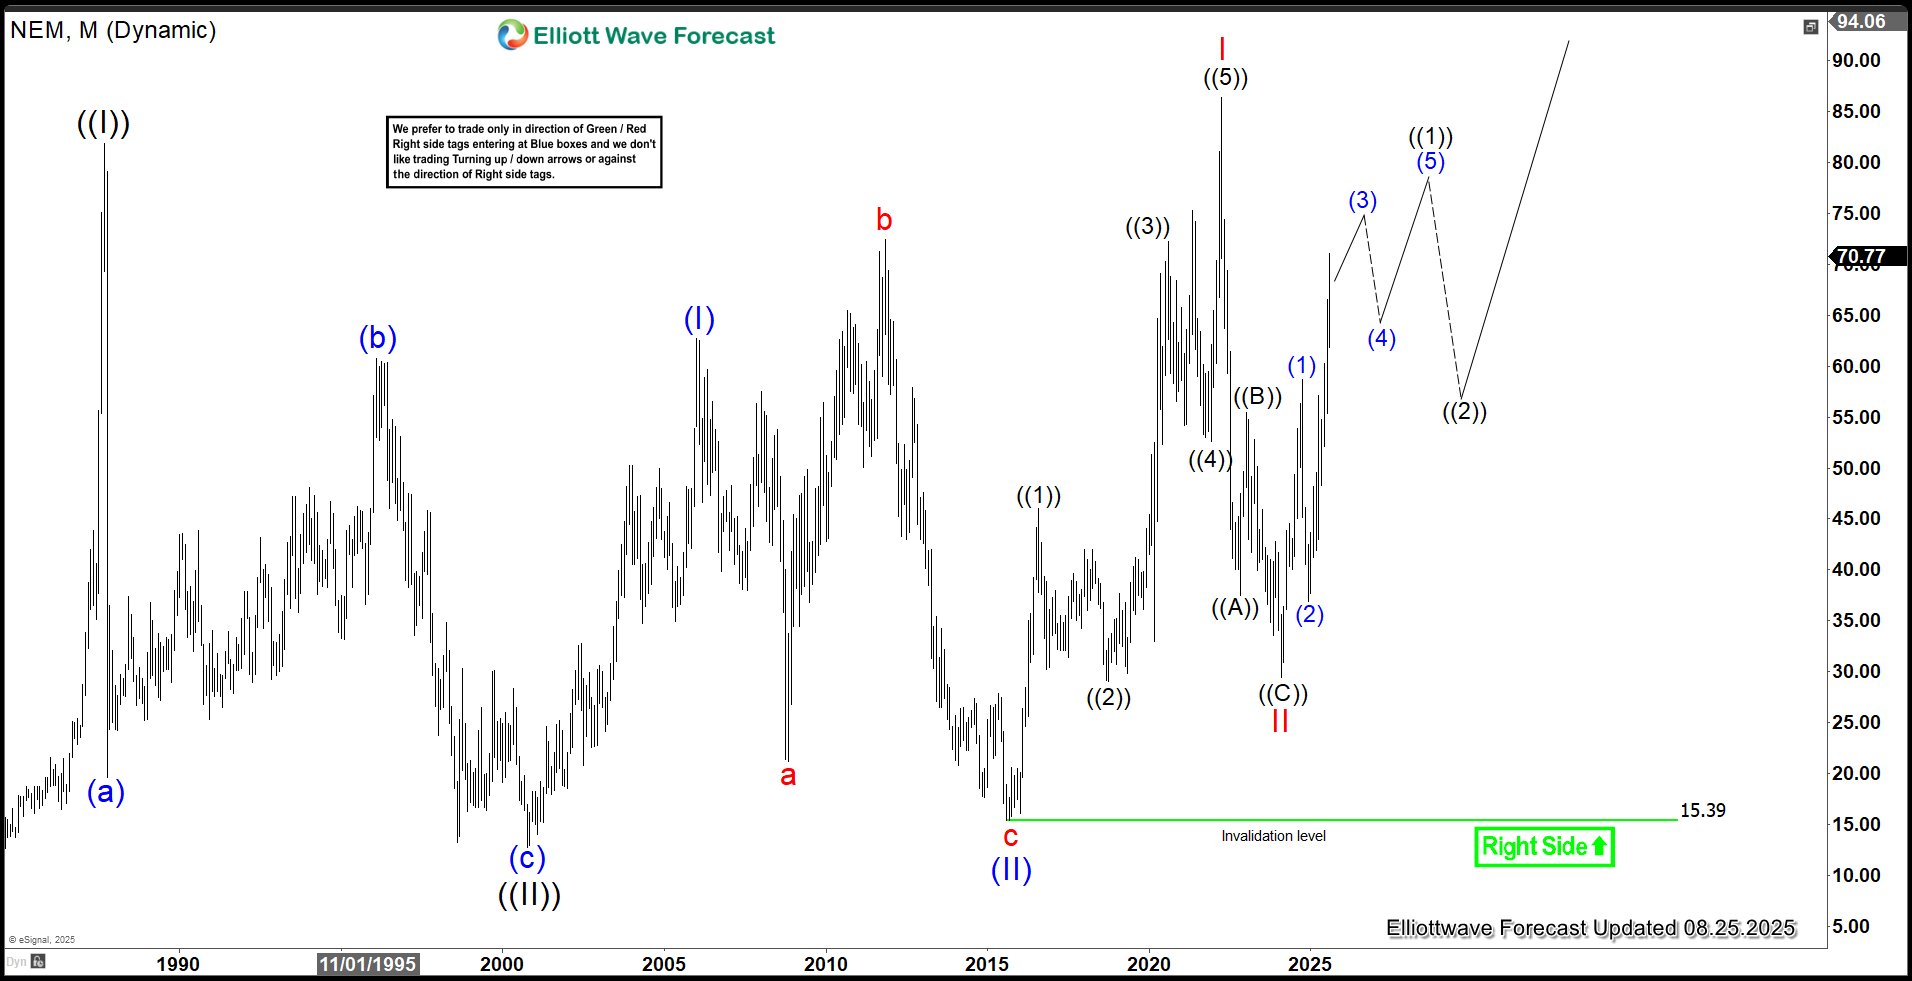
The monthly Elliott Wave analysis for Newmont Mining (NEM) indicates a bullish trend, having surpassed the prior peak of wave ((I)) at 81.92 in September 1987. The corrective wave ((II)) concluded with a three-wave decline to 12.75, after which the stock began a new upward impulse in wave ((III)). From the wave ((II)) low, wave (I) reached 62.72, followed by a wave (II) correction to 15.39. The stock then advanced in wave I of (III) to 86.37, with wave II of (III) bottoming at 29.42. As long as the 15.39 low holds, further upside is anticipated.
Newmont Daily Elliott Wave Chart
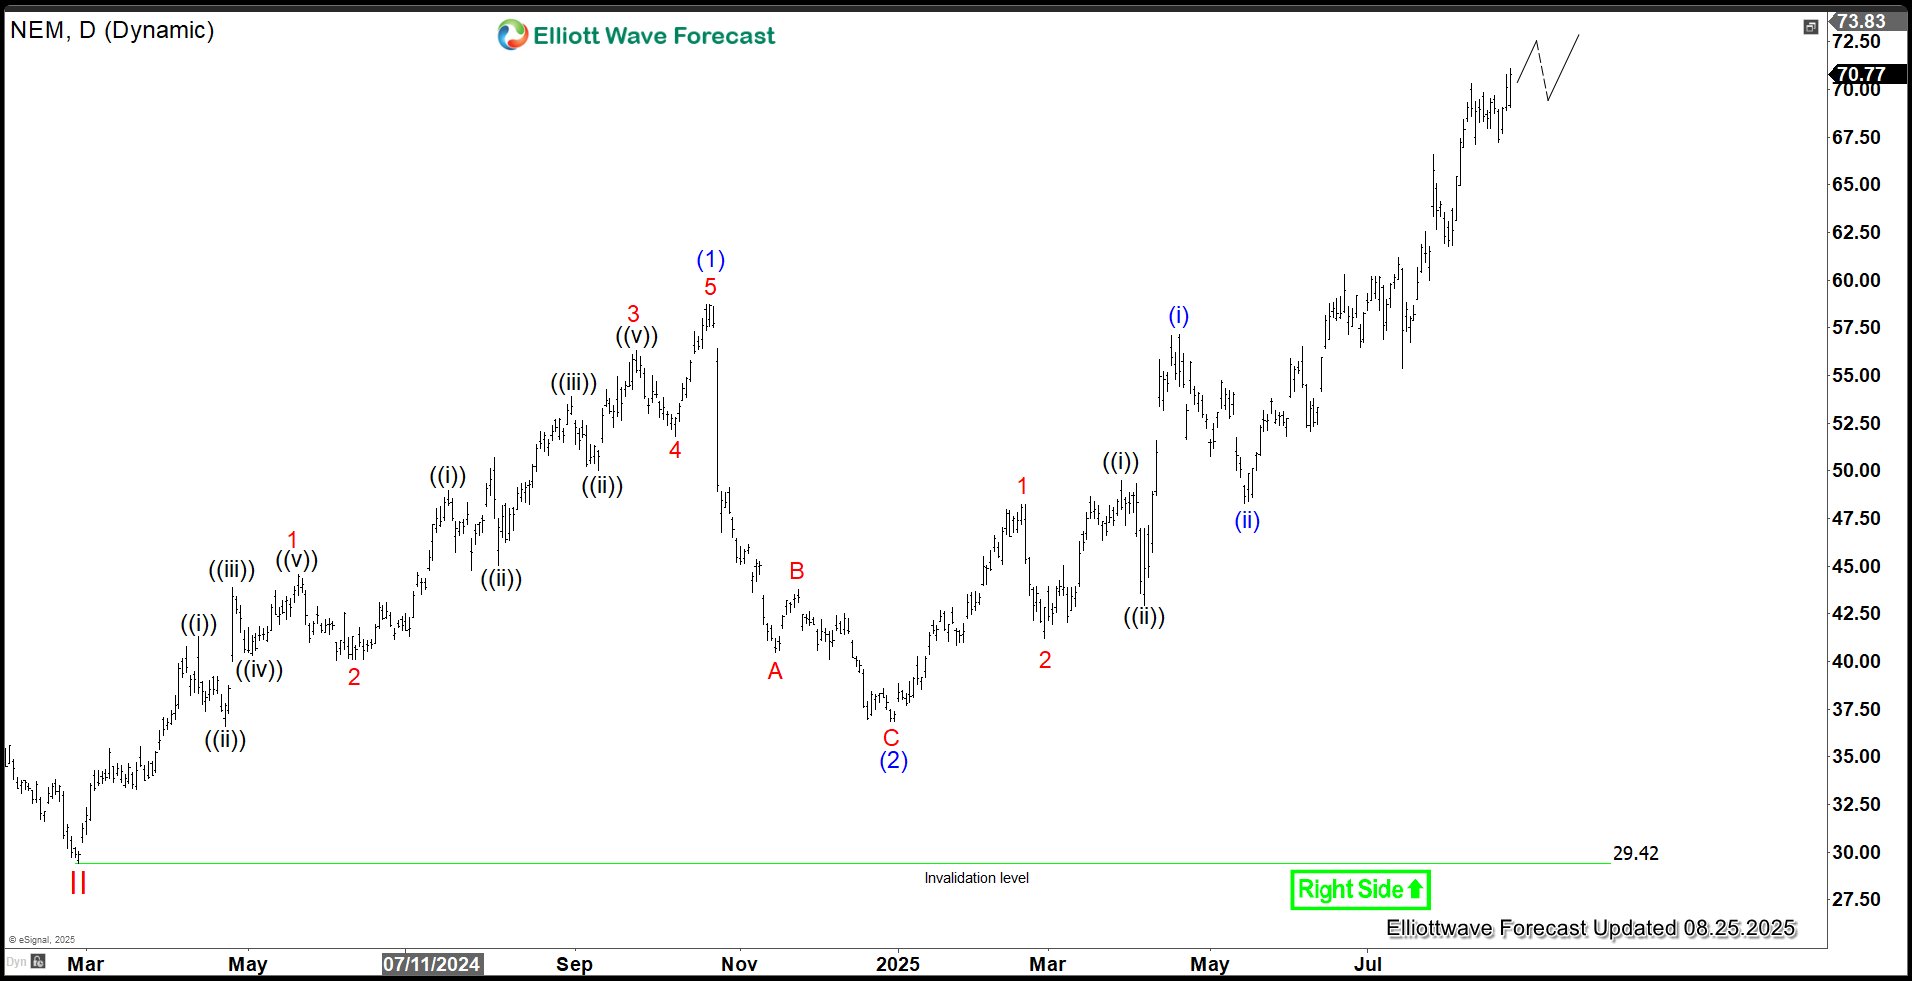
The daily Elliott Wave analysis for Newmont Mining (NEM) indicates that the stock completed its wave II correction at 37.57 and has since begun advancing in wave III. From the wave II low, wave (1) peaked at 58.72, followed by a wave (2) retracement to 36.86. As long as the key support at 29.42 remains unbroken, expect further gains in the stock.
風險提示:本文所述僅代表作者個人觀點,不代表 Followme 的官方立場。Followme 不對內容的準確性、完整性或可靠性作出任何保證,對於基於該內容所採取的任何行為,不承擔任何責任,除非另有書面明確說明。
 暫無留言。 來發表第一則觀點吧。