


Robinhood (NASDAQ: HOOD) rallied more than 300% since April 2025 breaking into new all time highs. In our previous article, we explained the bullish sequence taking place within the weekly cycle leading to this strong surge. In today’s article, we explore the Elliott Wave structure, outlining potential paths and targets for its continued bullish momentum.
Elliott Wave Analysis
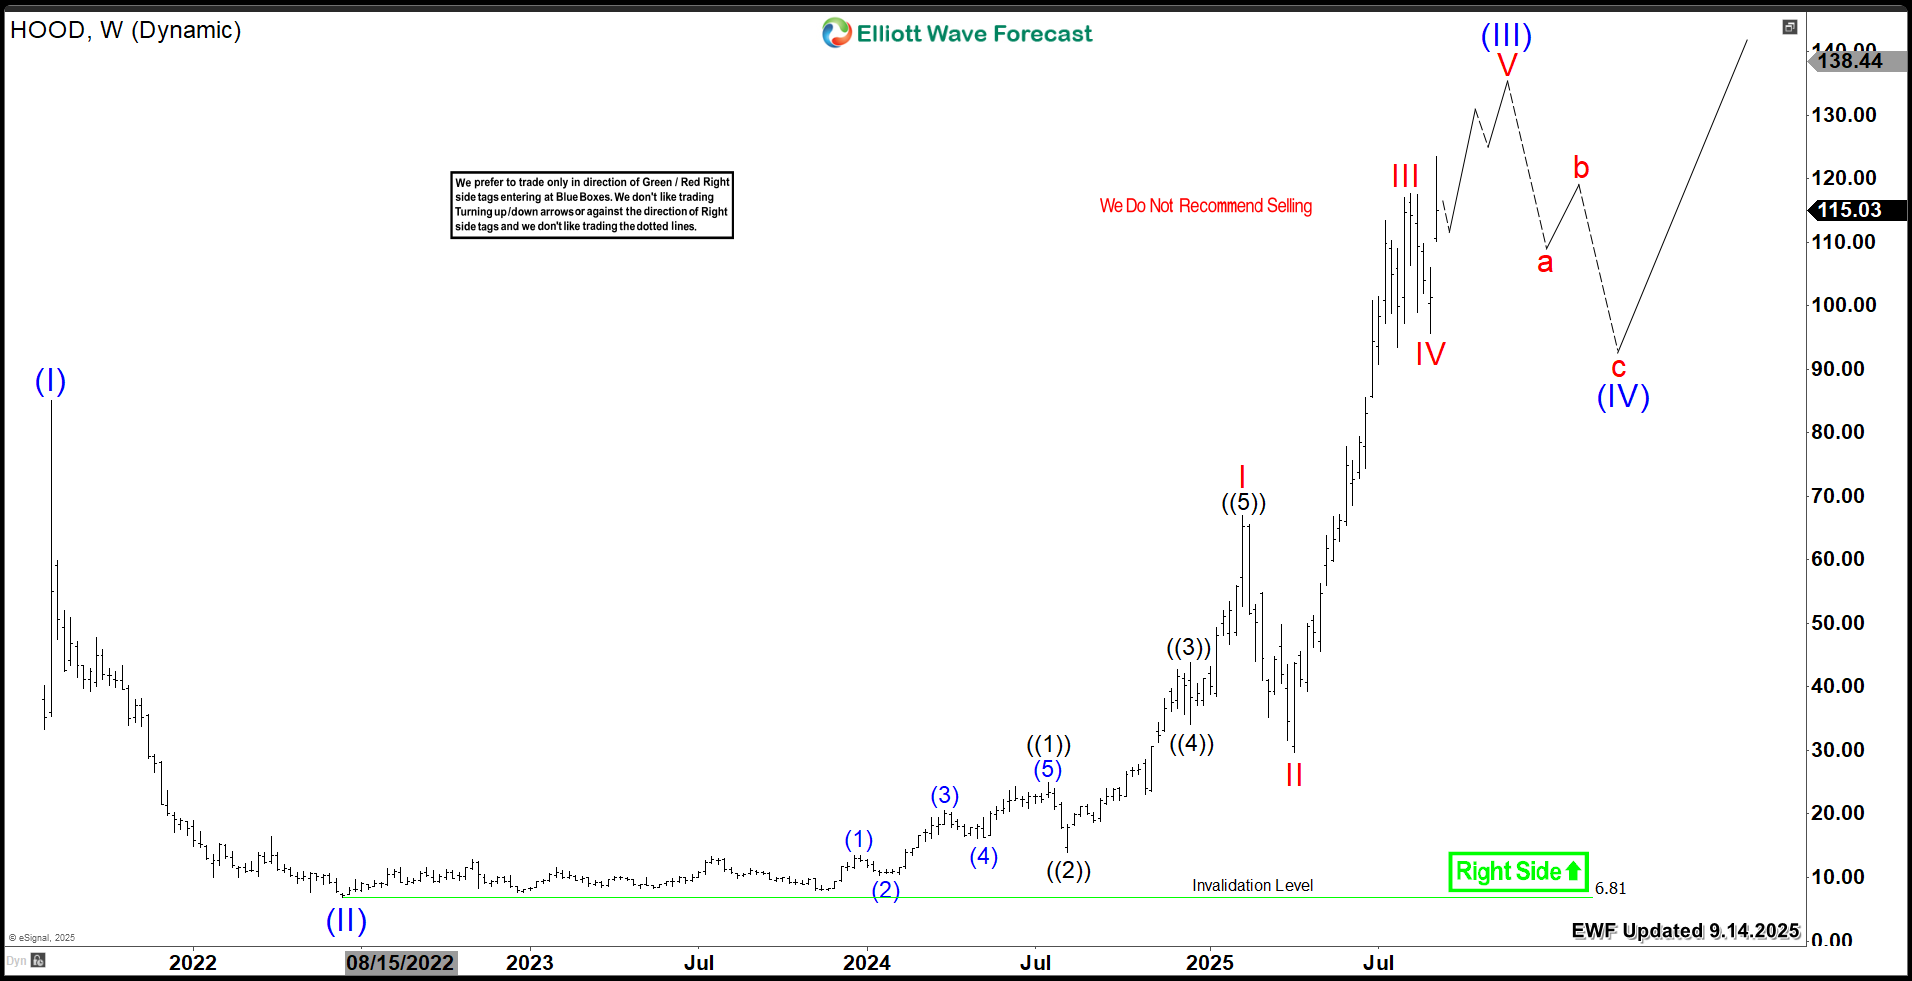
Robinhood is showing 3 swings into new all time highs. That is to say the stock has an incomplete bullish sequence within the super cycle degree.
HOOD rally from 2022 low is currently unfolding within a 5 waves advance as the stock is entering the final phase of the impulsive wave (III). The minimum target was already reached at $122. However as long as recent September low $95.66 holds then the stock can see further extension higher within wave V toward $131 and above.
Buyers should be cautious at this stage because once wave (III) ends, a larger correction in wave (IV) is expected to take place which will be a better buying opportunity.
HOOD Weekly Chart 09.14.2025
Conclusion
HOOD overall bullish structure support the stock through the upcoming correction, creating opportunities to buy daily and weekly pullbacks using our Elliott Wave strategy. The ideal approach is to enter positions once the stock completes a 3, 7, or 11 swing sequence from its peak. Moreover, our extreme Blue Box system enhances precision, allowing traders to identify optimal entry points with clarity and confidence.
風險提示:本文所述僅代表作者個人觀點,不代表 Followme 的官方立場。Followme 不對內容的準確性、完整性或可靠性作出任何保證,對於基於該內容所採取的任何行為,不承擔任何責任,除非另有書面明確說明。
 暫無留言。 來發表第一則觀點吧。