


IONQ Inc., a trailblazer in quantum computing, specializes in developing and manufacturing quantum computers. Founded in 2015 by Christopher Monroe and Jung Sang Kim, the company is based in College Park, Maryland.
This technical analysis of IONQ's weekly stock chart reveals key insights:
After a 3-wave pullback, the stock surged to new all-time highs.
This breakout confirms the potential for further growth, targeting the 65.84-73.16 range.
Based on this analysis, our recommendation is to hold onto your shares, as selling may not be the best strategy at this point.
IONQ Weekly Chart From 4.22.2025
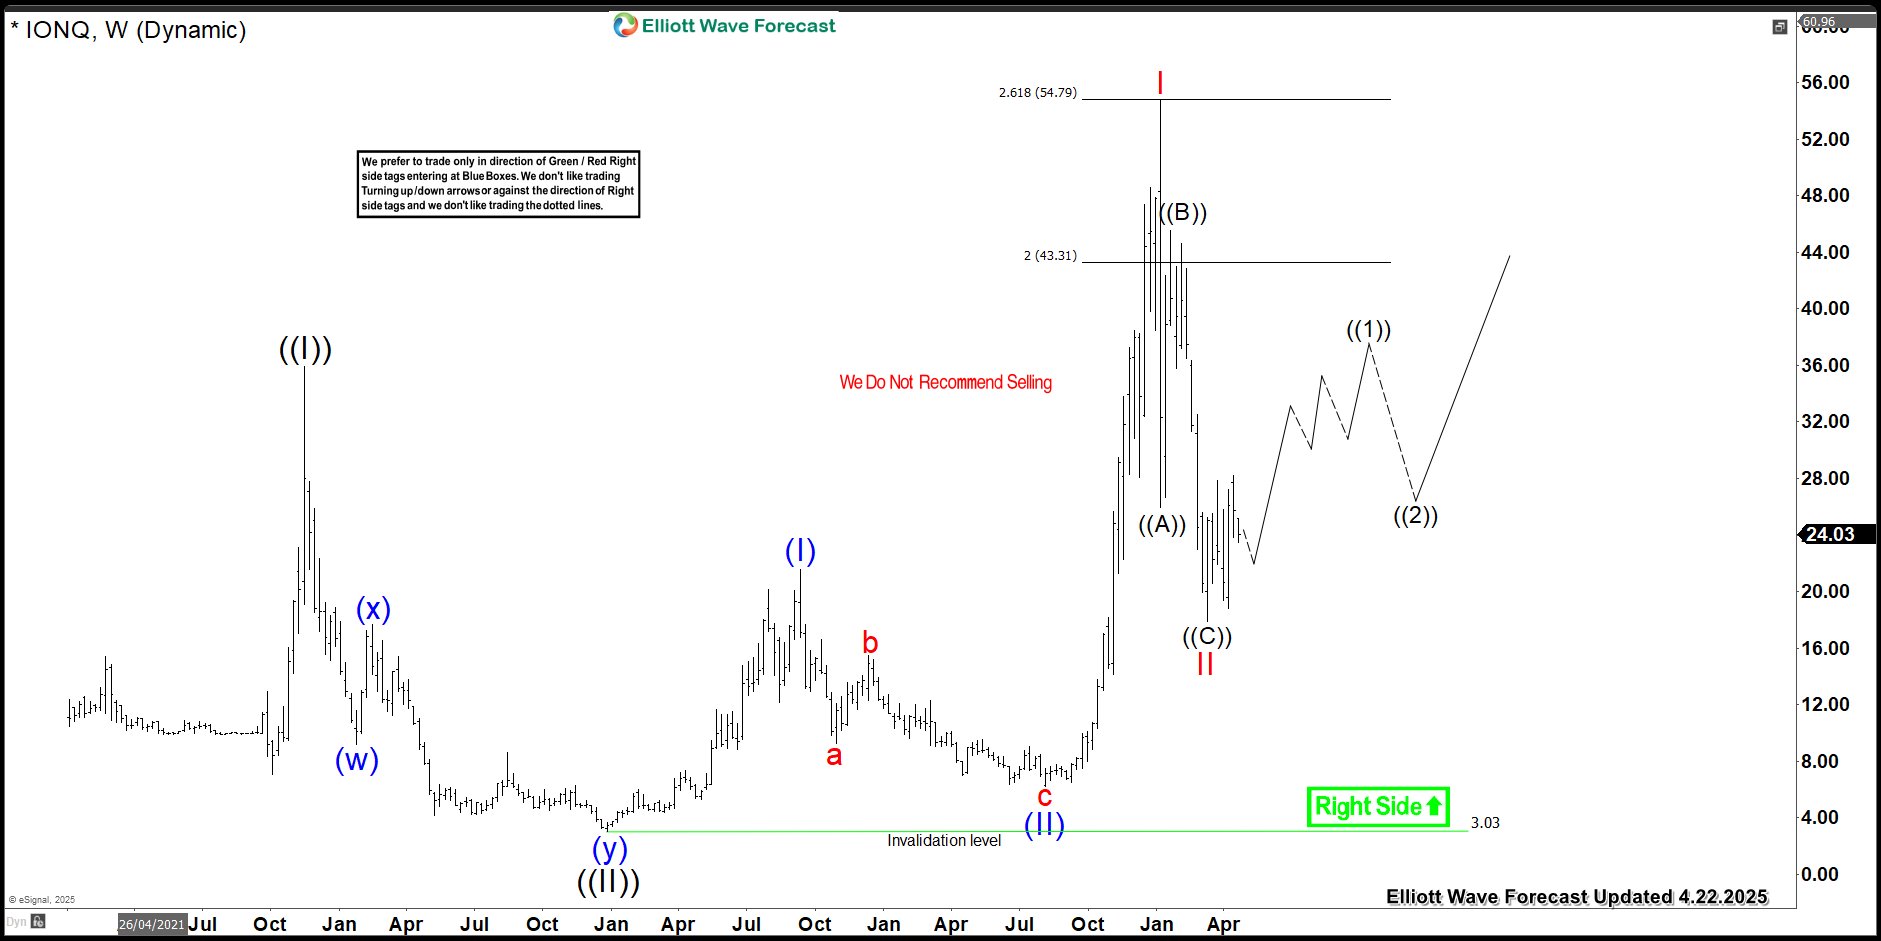
IONQ's past update covered stock price action can be broken down as follows: The rally to $35.90 marked the end of wave ((I)), followed by a pullback that formed a double three structure. This pullback consisted of wave (w) ending at $9.16. A bounce in wave (x) to $17.66, and wave (y) concluding at $3.03.
Subsequently, the stock entered an impulse sequence, with wave (I) peaking at $21.60 and wave (II) correcting to $6.22. A strong rally ensued, culminating in wave I at $54.74, followed by a 3-wave pullback in wave II. This pullback unfolded as a zigzag correction: wave ((A)) ended at $25.92, wave ((B)) bounced to $45.56, and wave ((C)) concluded at $17.88.
IONQ Latest Elliott Wave Chart From 9.15.2025
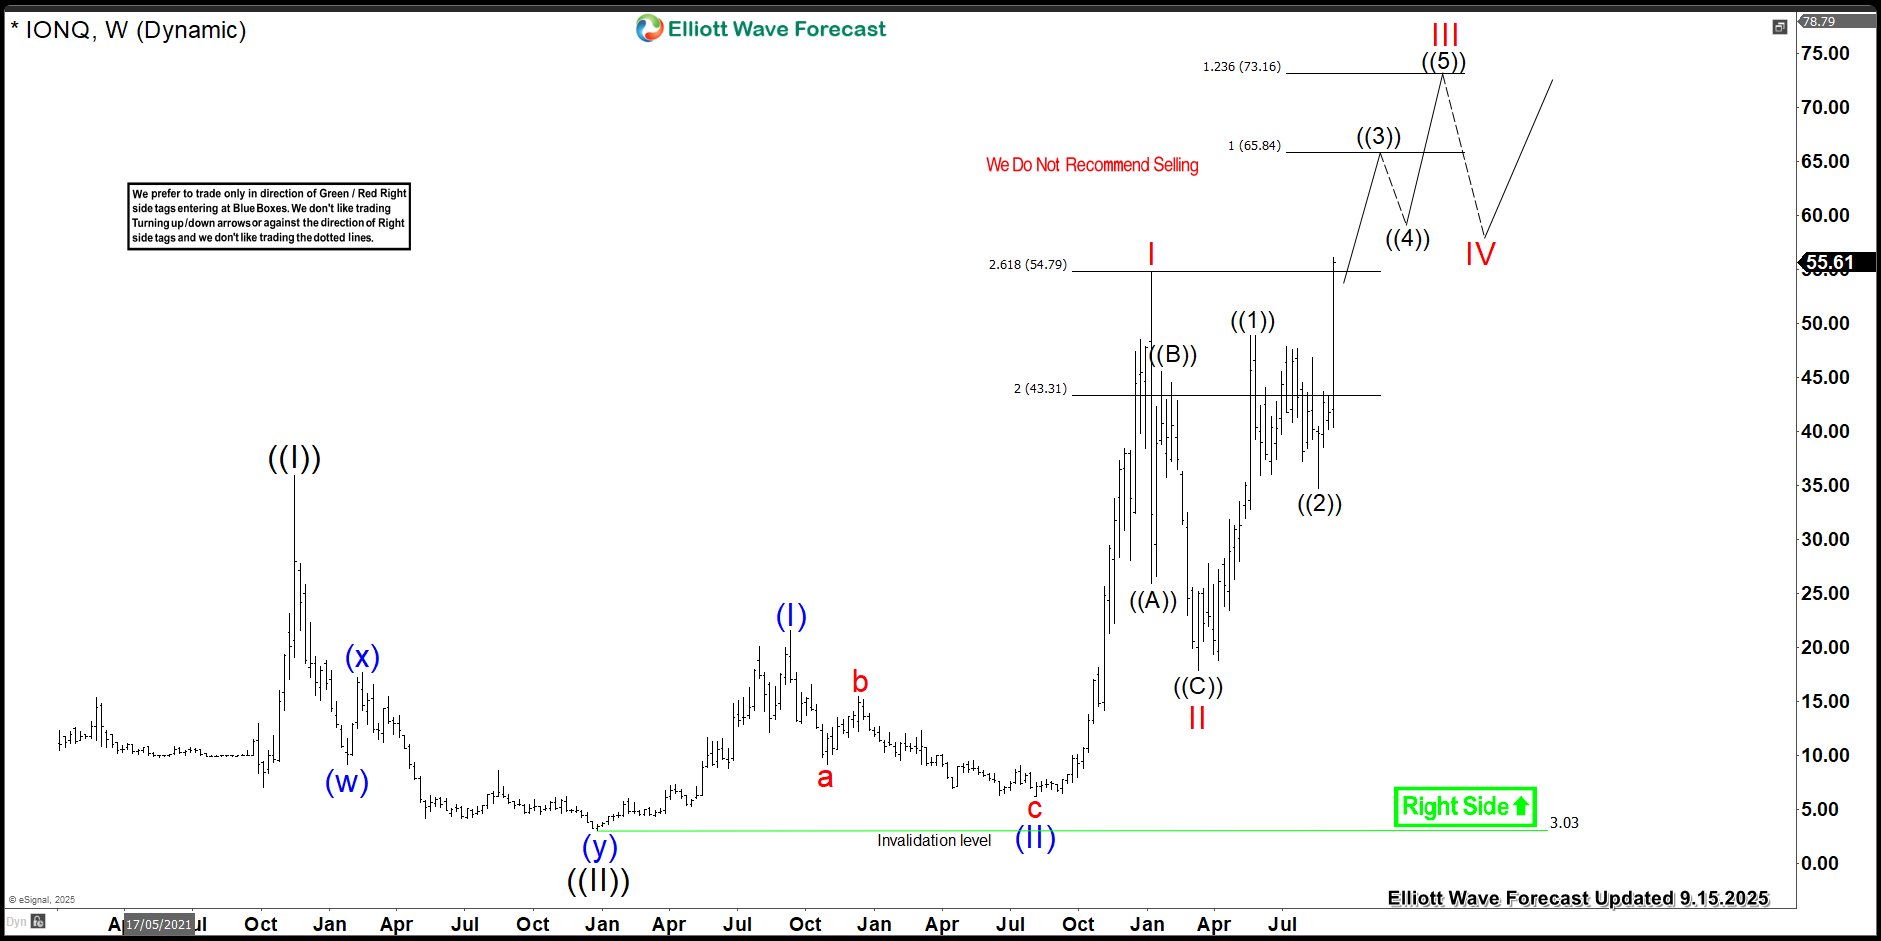
Since then, IONQ has surged to new all-time highs, indicating potential for further growth towards the $65.84-$73.16 range. Until this target is reached, dips are expected to remain supported within 3, 7, or 11 swings. Based on this analysis, selling is not recommended.
風險提示:本文所述僅代表作者個人觀點,不代表 Followme 的官方立場。Followme 不對內容的準確性、完整性或可靠性作出任何保證,對於基於該內容所採取的任何行為,不承擔任何責任,除非另有書面明確說明。
 暫無留言。 來發表第一則觀點吧。