Newmont Mining Corporation (NEM) is a leading global gold mining company. It stands as one of the largest producers of gold, with operations spanning North and South America, Africa, Australia, and Asia. This article looks at the Elliott Wave Outlook for the stock.
Newmont Monthly Elliott Wave Chart
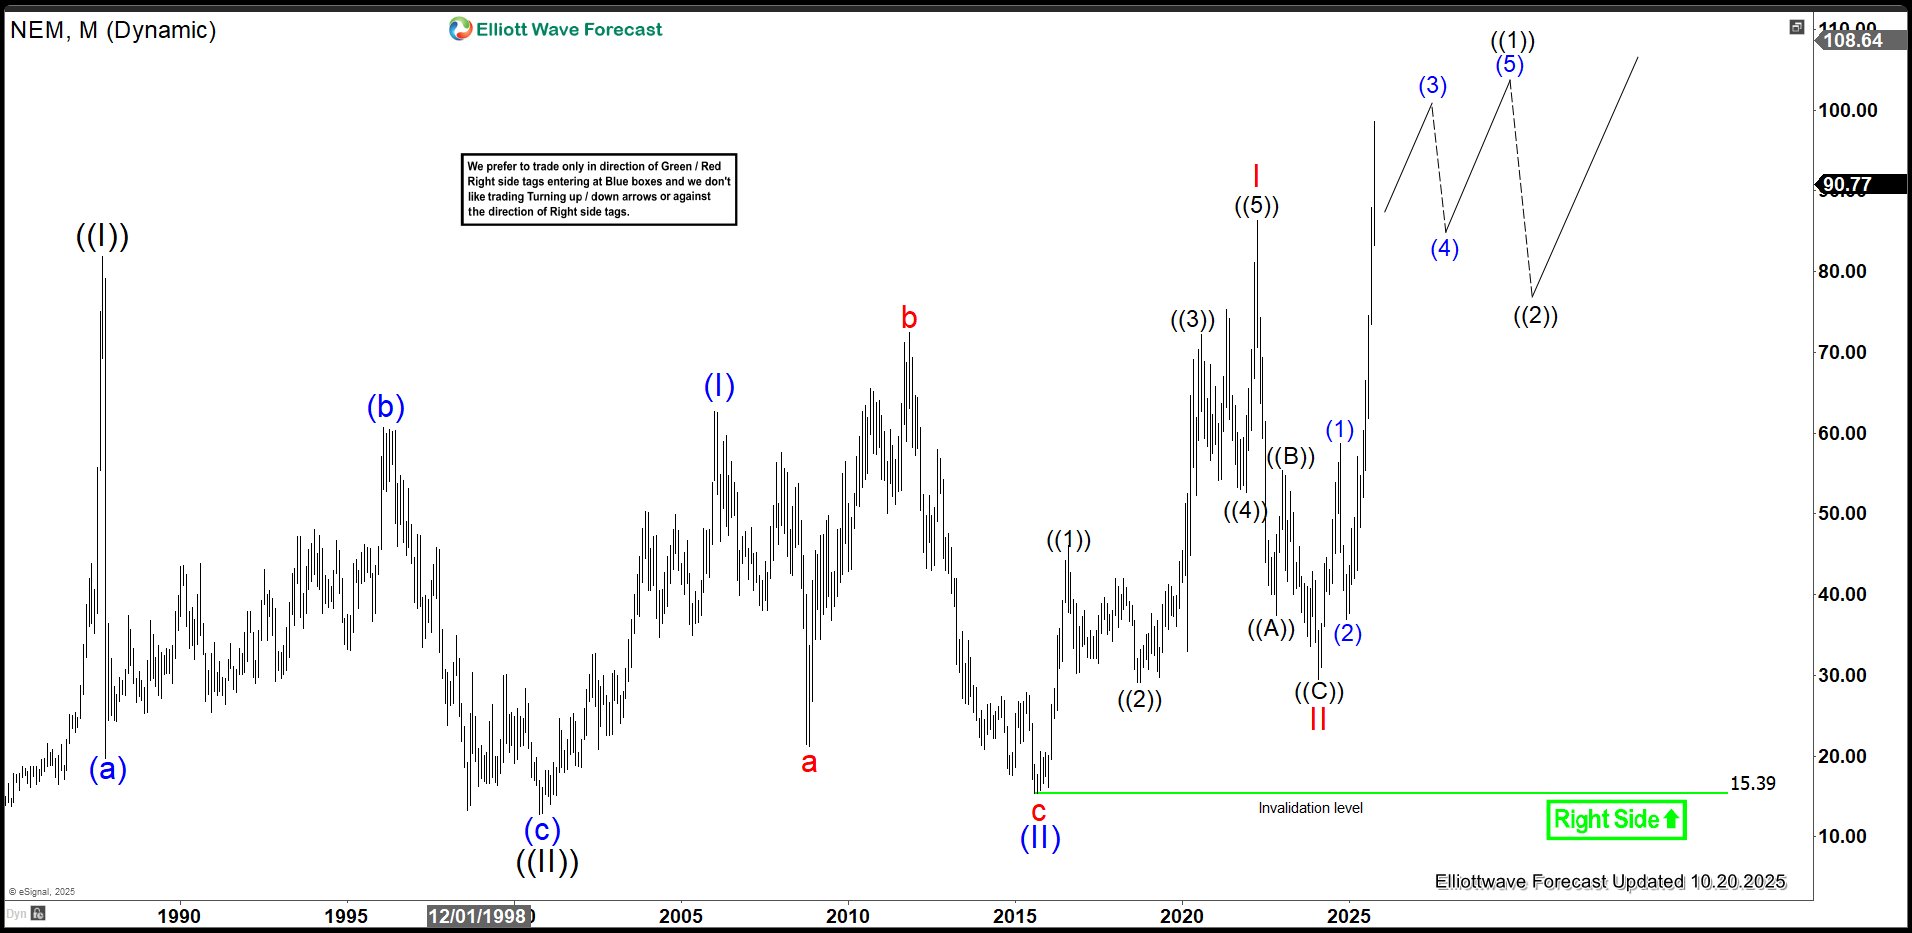 Newmont Mining (NEM) is riding a powerful bullish wave, as shown in its monthly Elliott Wave chart. The chart signals a breakout to a new all-time high. The stock completed wave ((II)) of the Grand Super Cycle at $12.75 in September 2000, setting the stage for a dynamic nested impulse. Wave (I) surged to $62.72, followed by a wave (II) pullback to $15.39. Now, wave (III) is driving higher, with wave I reaching $86.37 and wave II correcting to $29.42. As long as NEM stays above $15.39, the rally is likely to gain further momentum.
Newmont Daily Elliott Wave Chart
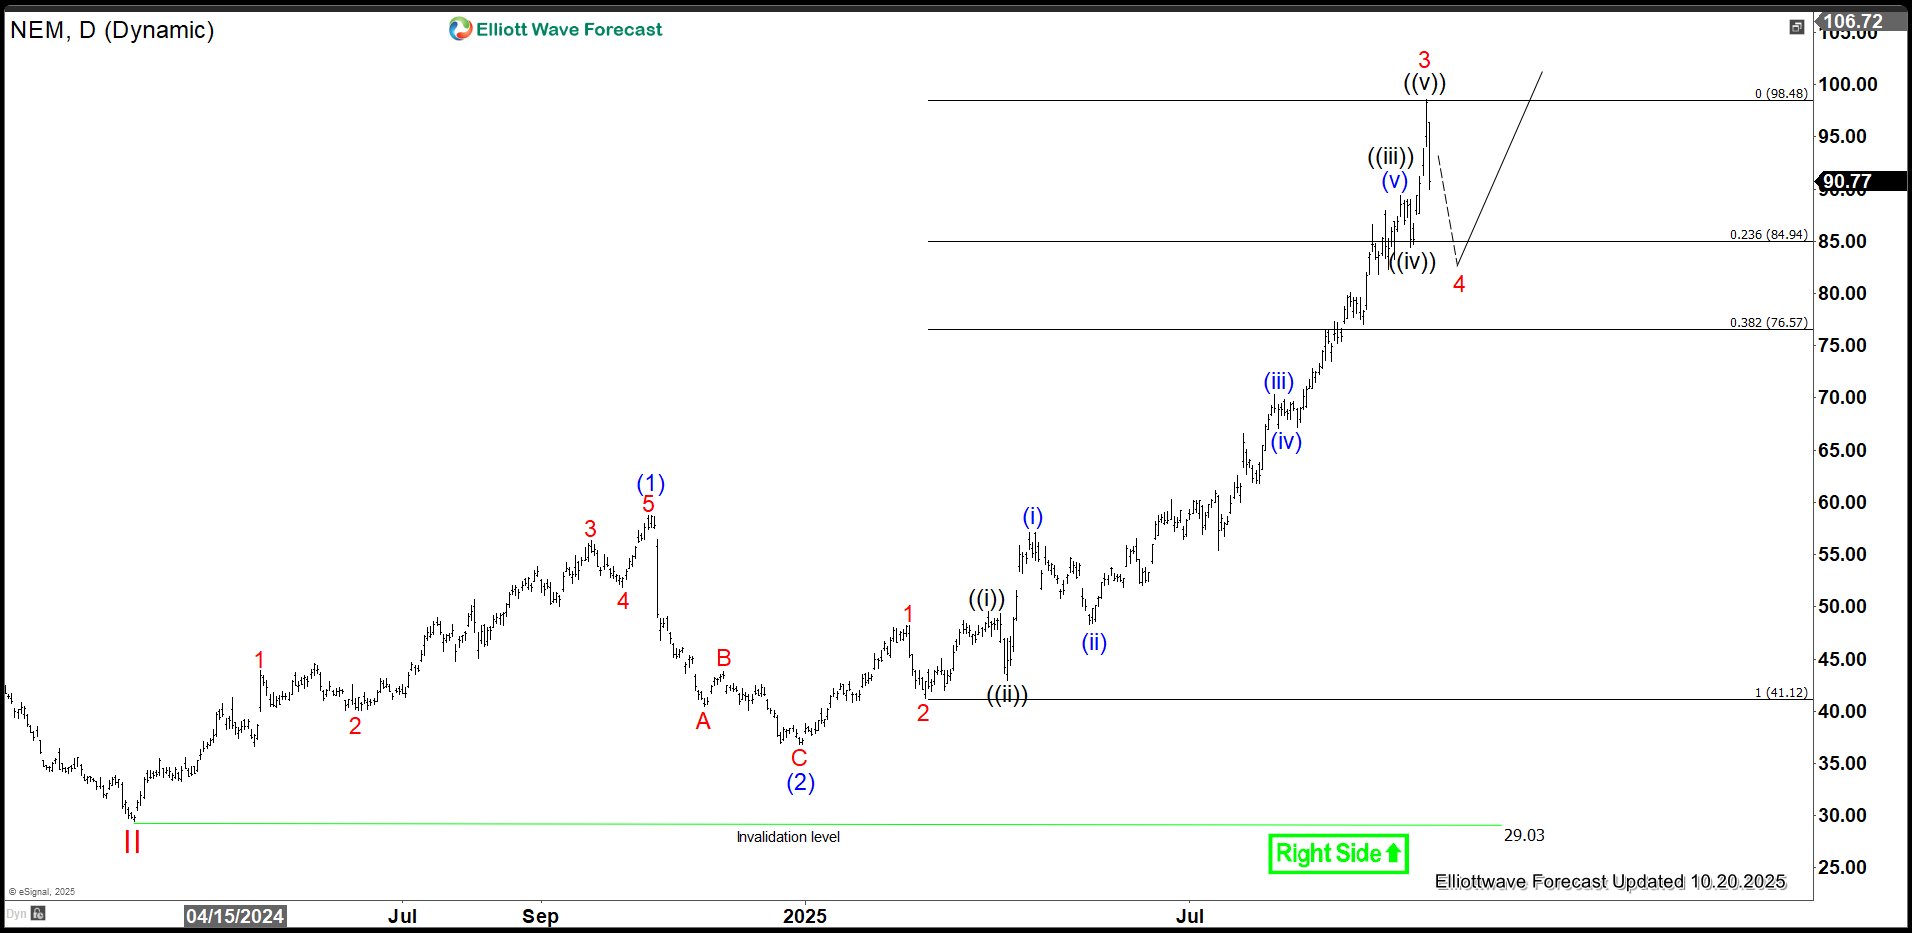
The daily Elliott Wave analysis for Newmont Mining (NEM) reveals a structured progression in its price movement. Having completed its wave II correction at $29.03, the stock has embarked on an upward trajectory in wave III. From the wave II low, the initial advance in wave (1) reached a high of $58.72. A retracement in wave (2) followed to $36.86. Provided the critical support level at $29.03 remains intact, Newmont Mining is well-positioned to sustain its upward momentum, advancing further within the framework of wave III.
風險提示:本文所述僅代表作者個人觀點,不代表 Followme 的官方立場。Followme 不對內容的準確性、完整性或可靠性作出任何保證,對於基於該內容所採取的任何行為,不承擔任何責任,除非另有書面明確說明。

暫無評論,立馬搶沙發