


Cameco Corporation (CCJ), a leading global producer of uranium, plays a pivotal role in the nuclear energy supply chain, mining and refining uranium. Headquartered in Canada, the company benefits from long-term contracts and a strong position in an industry poised for growth amid rising demand for clean, reliable energy. We will look at the long term Elliott Wave path in this blog.
Cameco ($CCJ) Monthly Elliott Wave Chart
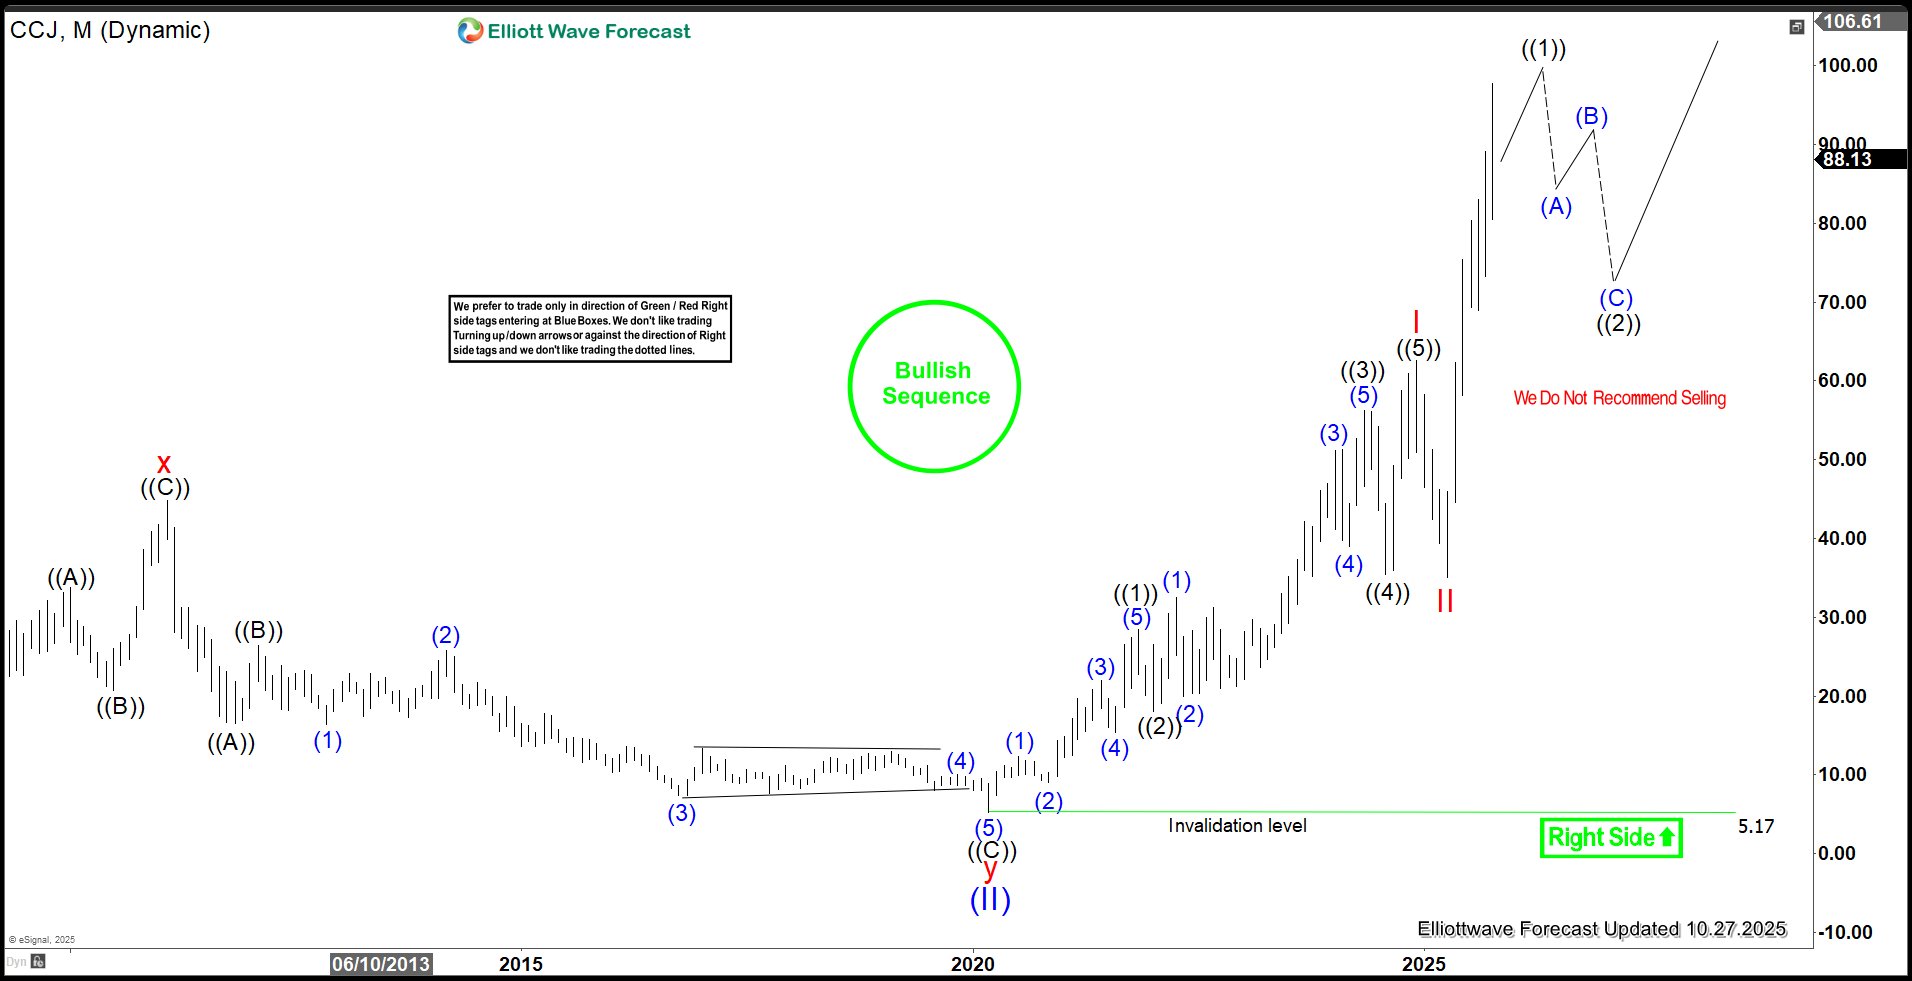
The monthly Elliott Wave chart for Cameco (CCJ) reveals that the stock completed a major long-term correction, labeled wave (II), at a low of $5.17. From this base, Cameco has initiated a new bullish cycle with substantial upside potential in the coming years. The stock is currently advancing in wave (III). From the wave (II) low, wave I peaked at $62.55. Wave II pullback followed to $35 in April 2025. The stock has since nested higher into wave III. Another leg up is expected to complete wave ((1)) of III. A subsequent pullback in wave ((2)) should follow before the uptrend resumes.
$CCJ Daily Elliott Wave Chart
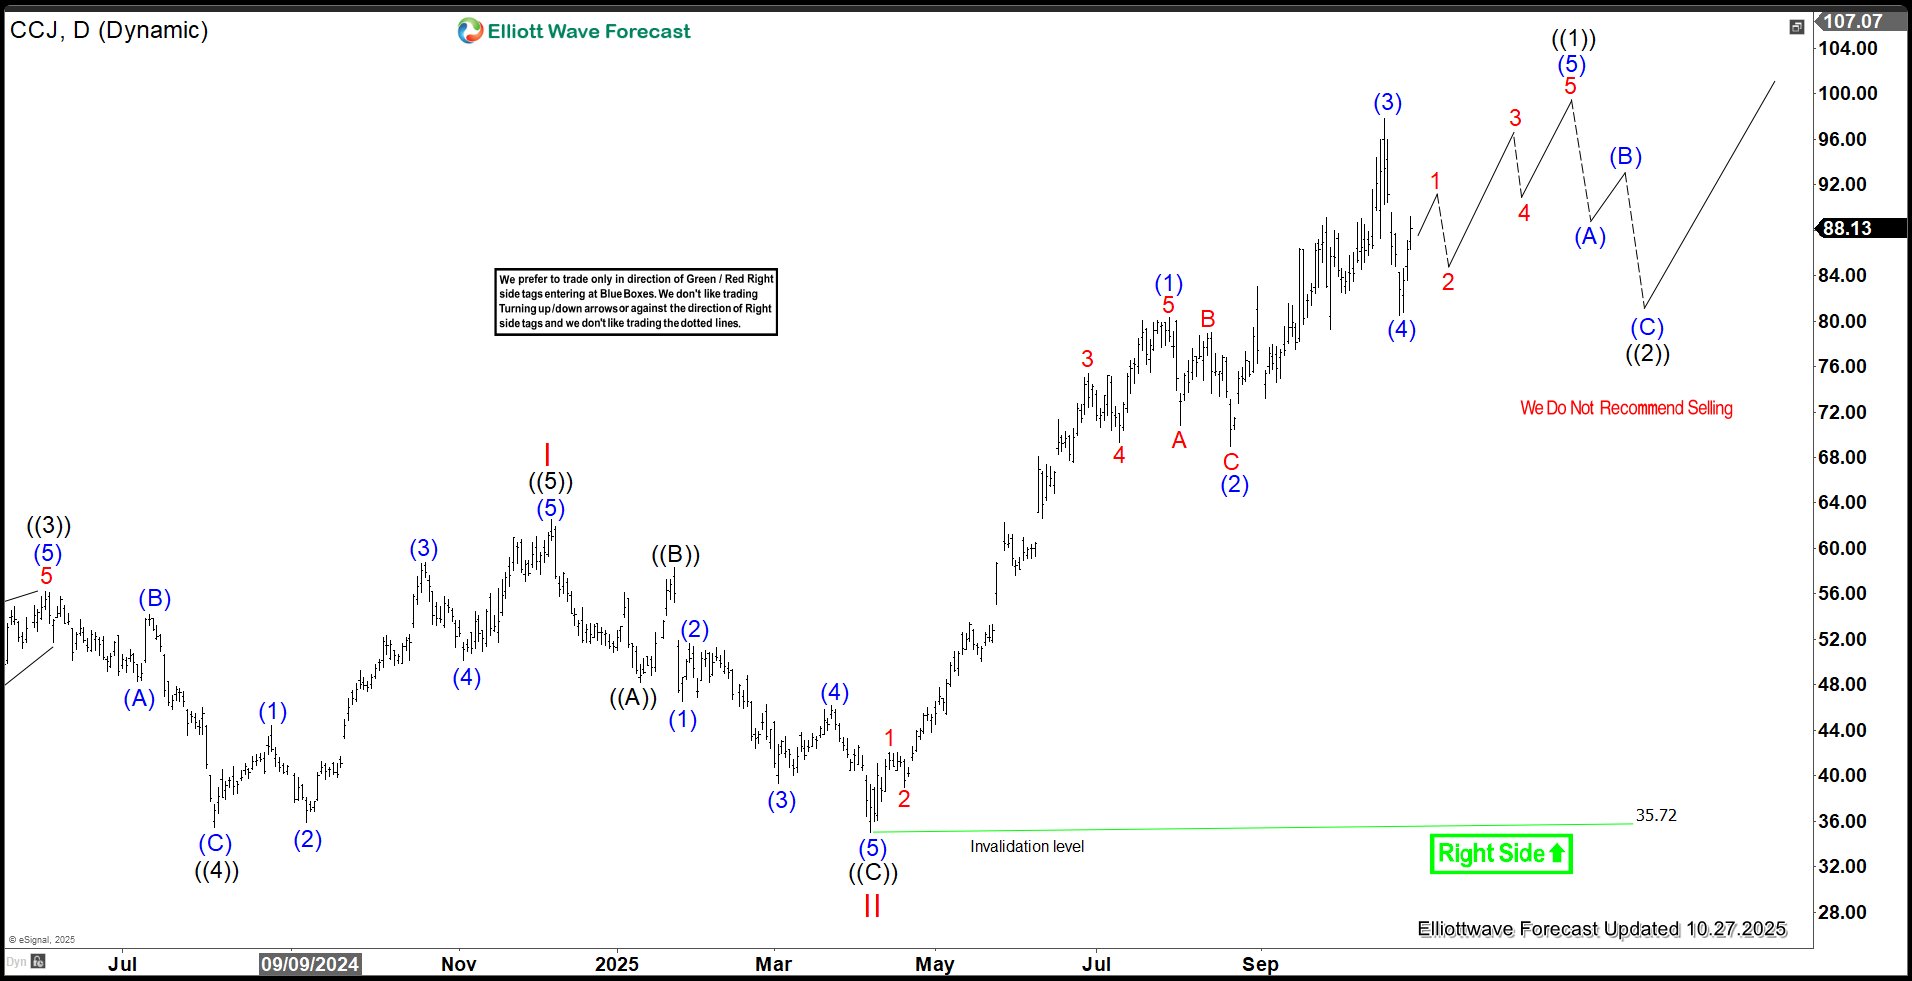
The daily Elliott Wave analysis of Cameco (CCJ) indicates that the cycle from the April 2025 low continues to unfold as a five-wave impulse. From that low, wave (1) completed at 80.32, followed by a wave (2) pullback that ended at 68.96. The stock then advanced in wave (3) to 97.79, with wave (4) dips concluding at 80.53. Wave (5) is expected to extend higher, completing wave ((1)) and the overall cycle from the April 2025 low. Subsequently, a wave ((2)) correction should pull back to adjust this cycle before the uptrend resumes. In the near term, as long as the pivot at 35.72 remains intact, any pullbacks should find support at the 3-, 7-, or 11-swing levels, setting the stage for further upside.
風險提示:本文所述僅代表作者個人觀點,不代表 Followme 的官方立場。Followme 不對內容的準確性、完整性或可靠性作出任何保證,對於基於該內容所採取的任何行為,不承擔任何責任,除非另有書面明確說明。
 暫無留言。 來發表第一則觀點吧。