


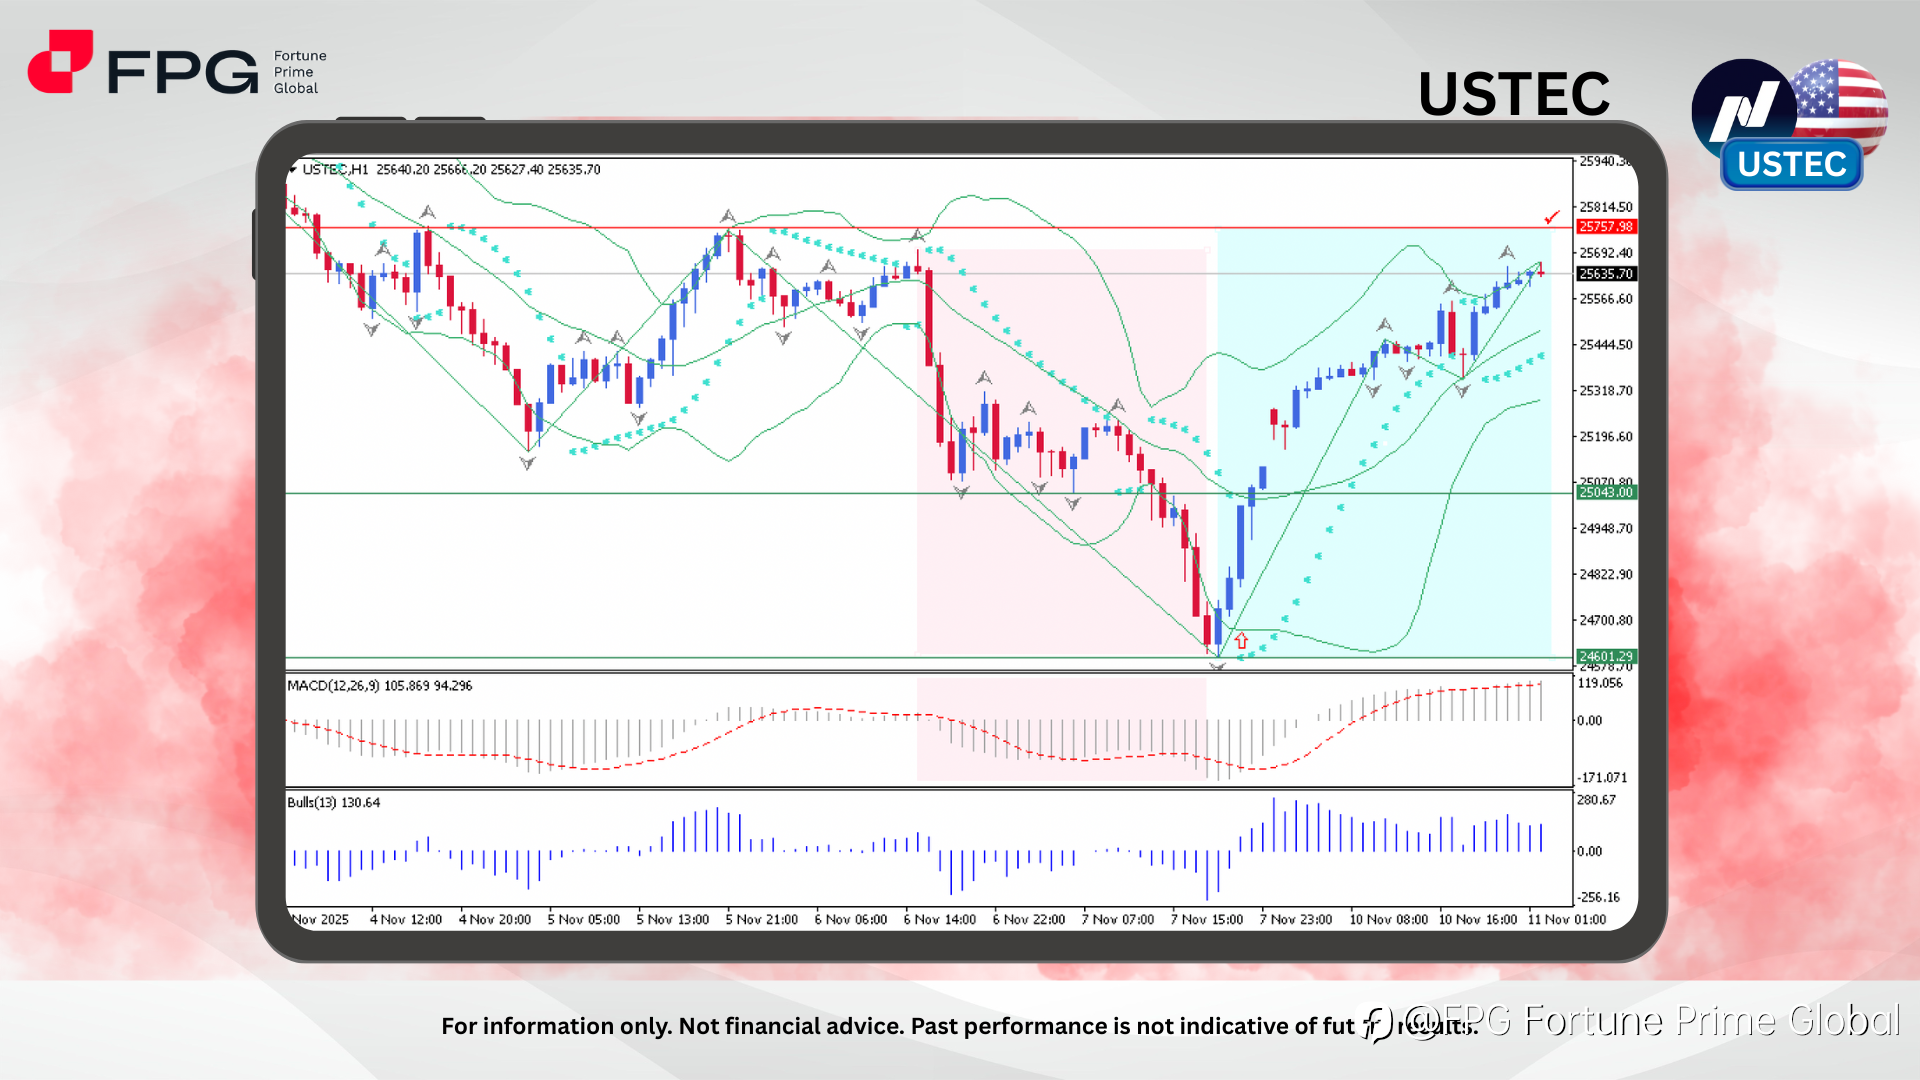
USTEC (Nasdaq) rebounded strongly after testing its crucial support at 24,601, marking a decisive turning point in its short-term trajectory. The index previously experienced a deep pullback from the 25,692 area, completing a clean V-shaped recovery as price action returned to hover near 25,635. This bounce confirms strong buyer interest at lower levels, suggesting that market participants are defending the support base and potentially preparing for another attempt toward the upper resistance region near 25,757.
From a technical perspective, several indicators show constructive signs of momentum recovery. The Bollinger Bands are widening with candles pressing the upper band, implying revived volatility alongside bullish pressure. The Parabolic SAR dots have flipped below the candles, reinforcing an ongoing upward bias. Meanwhile, the MACD histogram shows a steady increase, and both MACD lines are crossing above the signal line, signaling improving momentum and positive sentiment. The Bulls Power indicator remains in positive territory, confirming buyer strength that aligns with the bullish continuation pattern.
On the fundamental side, optimism in the U.S. tech sector continues to support the Nasdaq’s rise, driven by stronger-than-expected corporate earnings and cooling inflation data that boosted risk appetite. Investors are also factoring in the possibility of the Federal Reserve maintaining its current stance without additional rate hikes, providing relief for growth-oriented stocks. However, attention should remain on upcoming macroeconomic releases, which could inject volatility and influence short-term market direction.
Market Observation & Strategy Advice
1. Current Position: USTEC (Nasdaq) is currently trading around 25,635, showing strong bullish momentum after rebounding from the 24,601 low. The price is maintaining its position near the upper Bollinger Band, reflecting continued buying interest and upward pressure.
2. Resistance Zone: Immediate resistance is observed at 25,757 – 25,814, where previous rejection occurred. A sustained break above this zone could open the path toward higher targets near 26,000.
3. Support Zone: Key support levels lie at 25,043 and 24,601. A drop below 25,043 may trigger renewed bearish pressure and signal a potential retest of the lower support zone.
4. Indicators: Technical indicators continue to show bullish momentum. The Bollinger Bands are widening, and the Parabolic SAR remains below the candles, confirming upward bias. The MACD stays above zero, while Bulls Power remains positive, signaling strong buyer control.
5. Trading Strategy Suggestions:
- Buy on Dips: Look for long opportunities if price sustains above 25,500, with targets at 25,757 – 25,814 and possibly 26,000.
- Breakout Confirmation: Enter long positions only after a clear breakout above 25,814, supported by strong volume or momentum indicators.
- Reversal Opportunity: Consider short positions near 25,757 – 25,814 if price action shows rejection or reversal patterns, with stops placed tightly above resistance.
Market Performance:
Indices Last Price % Change
US500 6,836.7 +0.06%
US30 47.390,50 +0,08%
Today’s Key Economic Calendar:
AU: Westpac Consumer Confidence Change & Index
JP: Current Account
UK: BRC Retail Sales Monitor YoY
AU: NAB Business Confidence
UK: Employment Change
UK: Unemployment Rate
EU: ECB President Lagarde Speech
DE: ZEW Economic Sentiment Index
US: ADP Employment Change Weekly
Risk Disclaimer: This report is for informational purposes only and does not constitute financial advice. Investments involve risks, and past performance does not guarantee future results. Consult your financial advisor for personalized investment strategies.
風險提示:本文所述僅代表作者個人觀點,不代表 Followme 的官方立場。Followme 不對內容的準確性、完整性或可靠性作出任何保證,對於基於該內容所採取的任何行為,不承擔任何責任,除非另有書面明確說明。
 暫無留言。 來發表第一則觀點吧。