


CBA-ASX, Commonwealth Bank of Australia (ASX: CBA) is extending the bearish cycle from June 2025 high. it could be eyeing the blue box where it becomes attractive to buyers again.
Commonwealth Bank of Australia (ASX: CBA) is Australia's largest bank and one of the country's most valuable publicly listed companies. Founded in 1911 and headquartered in Sydney, the bank provides retail, business, institutional, and wealth management services to millions of customers across Australia and New Zealand.
CBA-ASX is widely recognized for its strong market position, digital banking leadership, and consistent profitability. Its core businesses include home lending, deposits, business banking, credit cards, payments, and institutional banking, making it a cornerstone of Australia's financial sector.
CBA-ASX Elliott Wave Analysis - Weekly Chart
CBA has been in an all-time bullish cycle since its launch in September 1991. It completed wave I of the cycle degree in November 2007. Afterwards, a wave II pullback followed to the lows of January 2009. From the lows of January 2009, an impulse wave structure emerged to complete wave ((1)) of III in March 2015 before a simple zigzag corrected it in wave ((2)). Wave ((2)) finished in March 2020. From the low of March 2020, a strong impulse wave sequence emerged for wave ((3)) to a fresh record high as the weekly chart below shows.
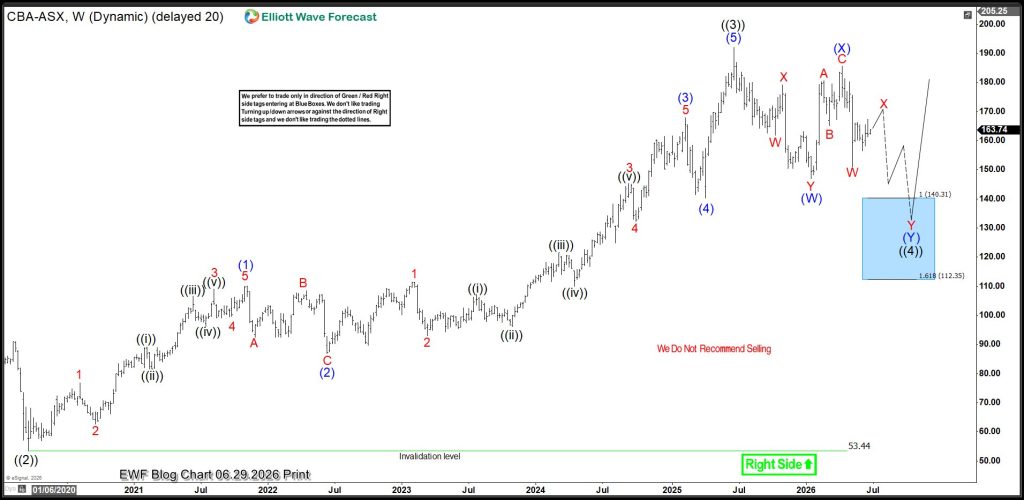
The chart above shows shows the clear sub-waves of wave ((3)). Having established a bullish sequence, buyers will focus on finding entries from the dips. Thus, wave ((4)) pullback would be a very good opportunity for long term buyers to position again. As the chart above shows, the wave ((4)) pullback is emerging as a double zigzag structure. The completion of the wave (X) connector helps us to identify the blue box zone at 140.31-112.35. Going forward - either wave ((4)) extends deeper into the blue box to trigger long positions or breaks higher without reaching for the wave (W) low. If the latter happens, we can identify end of wave ((4)) at the current (W) low. Thus, we can expect wave ((5)) at 202-219 at least.
If the double zigzag emerges lower as expected, traders can consider this trade idea from the blue box.
Long at 140.3
Stop at 111.4
Target 219
風險提示:本文所述僅代表作者個人觀點,不代表 Followme 的官方立場。Followme 不對內容的準確性、完整性或可靠性作出任何保證,對於基於該內容所採取的任何行為,不承擔任何責任,除非另有書面明確說明。
 暫無留言。 來發表第一則觀點吧。