


Goldman Sachs (NYSE: GS) extended its rally to new all-time highs. The stock broke above the $1000 milestone as we expected in our previous article. Today, we explore the Elliott Wave pattern dictating the current move. Our analysis explains the potential upside targets ahead.
Elliott Wave Analysis
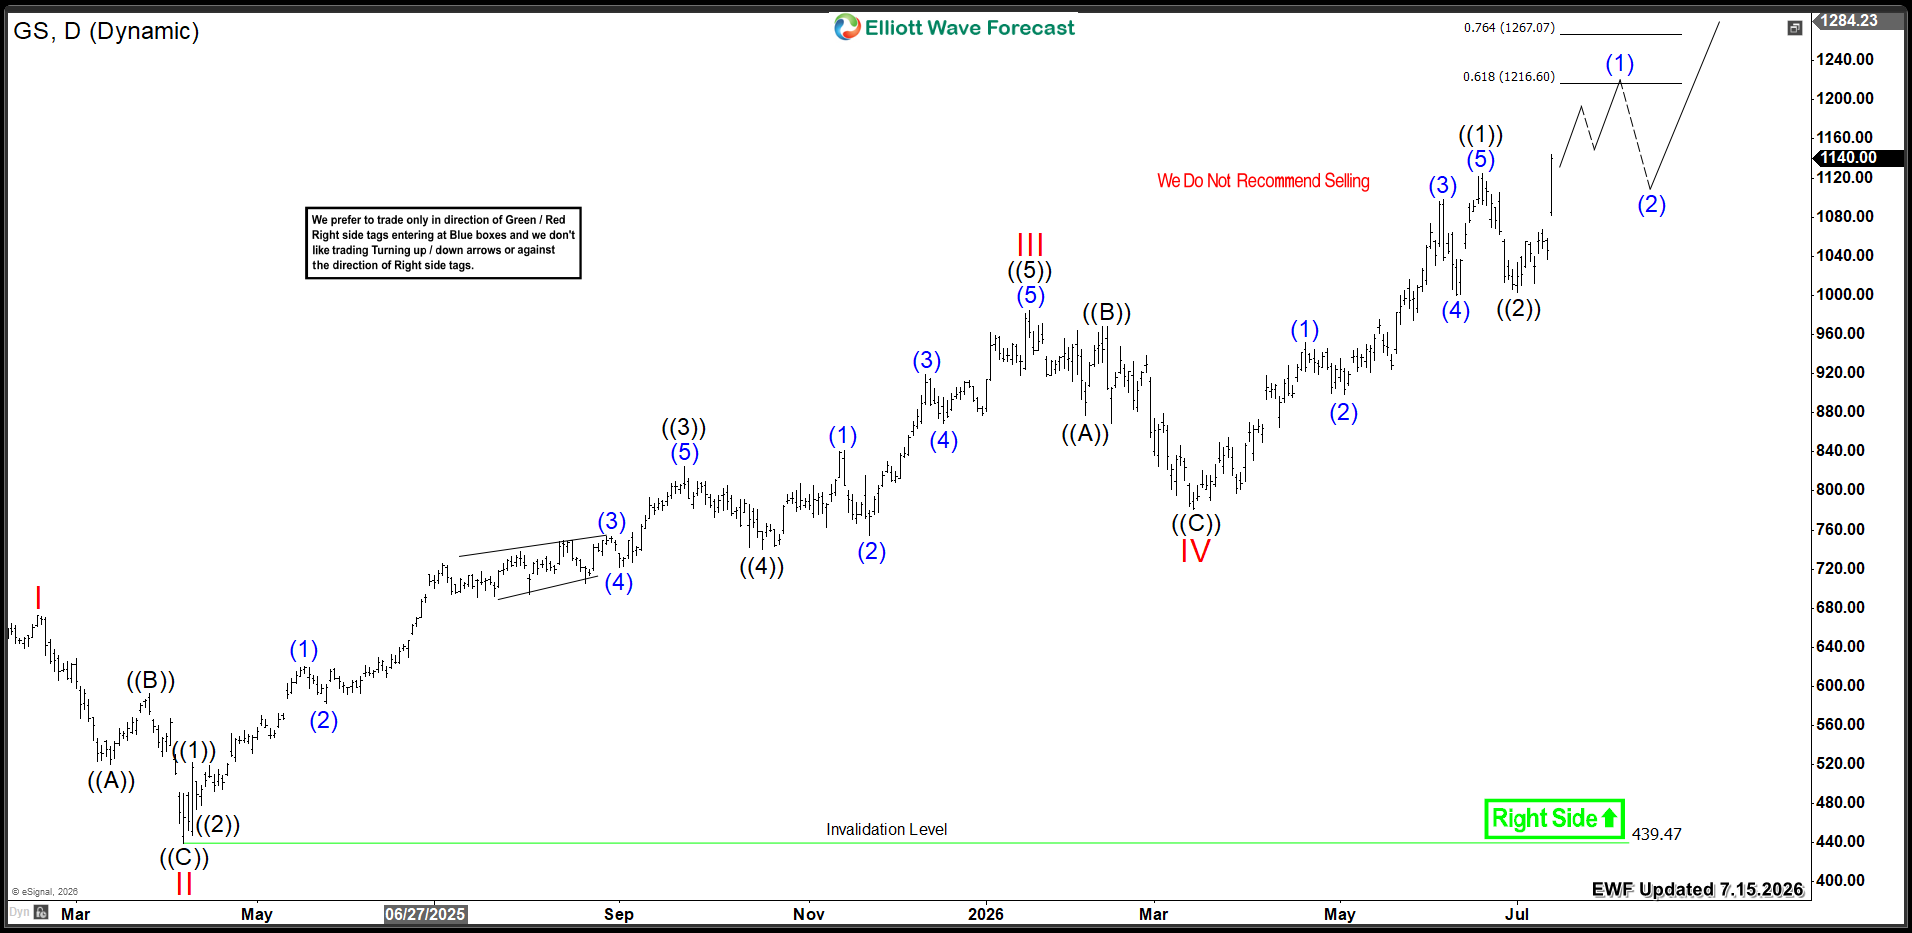
Goldman Sachs extended its rally from the March 2026 low of $780. The stock broke above the wave III peak of $980. Then, it crossed the $1000 milestone, opening the door for further upside. GS established an initial five-wave advance in wave ((1)), ending at $1125. Subsequently, wave ((2)) pulled back to $1003. Then, the stock resumed its rally higher in wave ((3)).
Therefore, GS must hold above the recent July low of wave ((2)). This support will allow the rally to continue. The next upside move should extend the stock toward the $1216 - $1267 target zone. Then, another correction will follow before further continuation.
Ideally, the cycle from the March 2026 low aims for the $1350 - $1560 equal legs area. This would set the stage for a stronger rally by year-end.
GS Daily Chart 7.15.2026
Conclusion
Goldman Sachs’s bullish cycle suggests further continuation beyond $1300 . Consequently, investors should target buying opportunities within daily pullbacks. Utilize our Elliott Wave strategy for precise entry timing.
風險提示:本文所述僅代表作者個人觀點,不代表 Followme 的官方立場。Followme 不對內容的準確性、完整性或可靠性作出任何保證,對於基於該內容所採取的任何行為,不承擔任何責任,除非另有書面明確說明。
 暫無留言。 來發表第一則觀點吧。