


NASDAQ Under Pressure as Yields and Oil Rise
The Nasdaq remains under pressure as rising Treasury yields and elevated oil prices weigh on technology and growth stocks. The Nasdaq Composite fell 1.00% to 26,067.17 on August 20, marking its weakest session in three weeks.
The Nasdaq-100 also declined, closing near 29,213, extending its recent pullback from the 30,000 area.
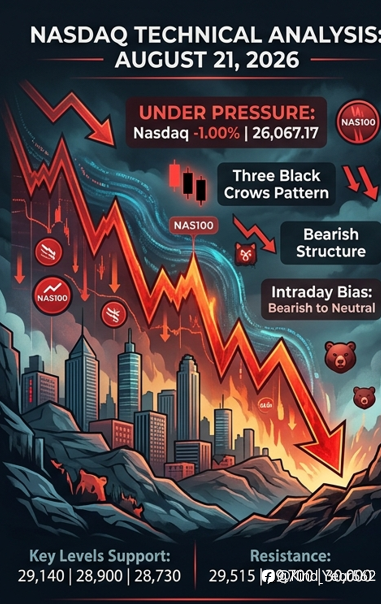
Technical Outlook
Structure: Bearish
Daily: Strong bearish pressure
4H/1H: Bearish structure
Weekly Trend: Bullish
Intraday Bias: Bearish to Neutral
Strategy: Sell on resistance / breakdown
The recent decline has weakened short-term momentum. Technical data also shows a Three Black Crows pattern on the Nasdaq-100 daily chart, supporting the current bearish short-term bias.
Key Levels
Support: 29,140 | 28,900 | 28,730
Resistance: 29,515 | 29,700 | 30,000
A sustained break below the 29,140–28,900 zone could increase downside pressure. Conversely, a recovery above 29,515–29,700 would weaken the immediate bearish setup and could bring 30,000 back into focus.
Fundamental Outlook
The biggest near-term risk remains the bond market. The U.S. 10-year Treasury yield was around 4.71%, while the 30-year yield reached approximately 5.25%. Higher yields can put additional pressure on high-growth technology valuations.
Oil prices are another concern, with Brent trading above $93 as geopolitical tensions continue to support energy prices. This raises renewed concerns about inflation and future interest-rate policy.
 #NASDAQ##technicalanalysis##market#
Conclusion
NASDAQ remains bearish in the short term. Traders should watch the 29,140–28,900 support zone closely. A breakdown may open the way for further downside, while a recovery above 29,700 could signal stabilization.
Bias: Bearish to Neutral 📉
Market analysis is for educational purposes only and is not financial advice.
風險提示:本文所述僅代表作者個人觀點,不代表 Followme 的官方立場。Followme 不對內容的準確性、完整性或可靠性作出任何保證,對於基於該內容所採取的任何行為,不承擔任何責任,除非另有書面明確說明。

-THE END-