· 閱讀量 874
- EUR/USD's is trading near 1.1847 versus Thursday's low of 1.1789.
- Thursday's candle suggests the pullback from recent highs may be over.
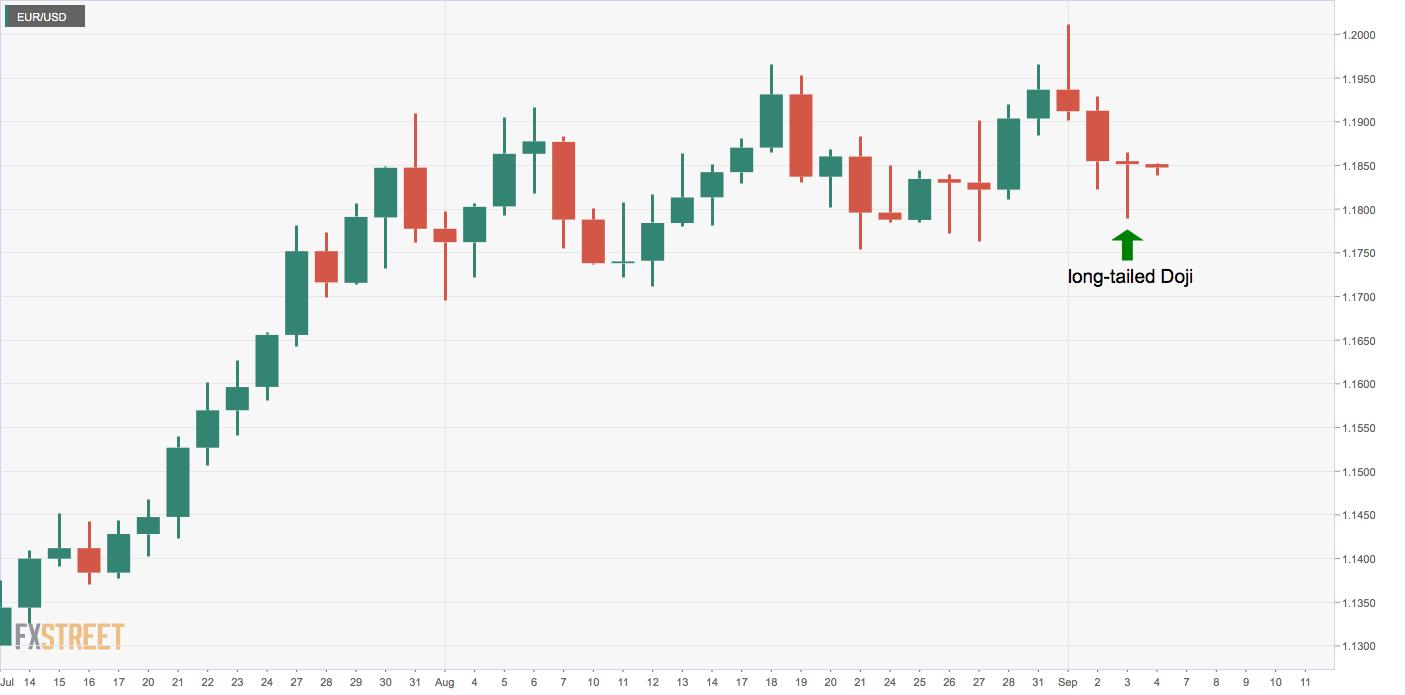
EUR/USD created a classic long-tailed Doji candle on Thursday, as it printed a low of 1.1789 but ended the day on a flat note 1.1851.
The long lower wick indicates seller exhaustion and suggests an end of the corrective pullback from recent highs above 1.20.
A sustained move above 1.1865 (Thursday's high) would confirm a bullish Doji reversal and could yield a move toward 1.19.
On the flip side, a daily close below 1.1789 – the low of Thursday's long-tailed Doji – would imply a continuation of the pullback from 1.20 and expose support at 1.1696 (Aug. 3 low).
Daily chart
Trend: Neutral
Technical levels
作者:Omkar Godbole,文章來源FXStreet,版權歸原作者所有,如有侵權請聯繫本人刪除。
風險提示:本文所述僅代表作者個人觀點,不代表 Followme 的官方立場。Followme 不對內容的準確性、完整性或可靠性作出任何保證,對於基於該內容所採取的任何行為,不承擔任何責任,除非另有書面明確說明。
喜歡的話,讚賞支持一下

暫無評論,立馬搶沙發