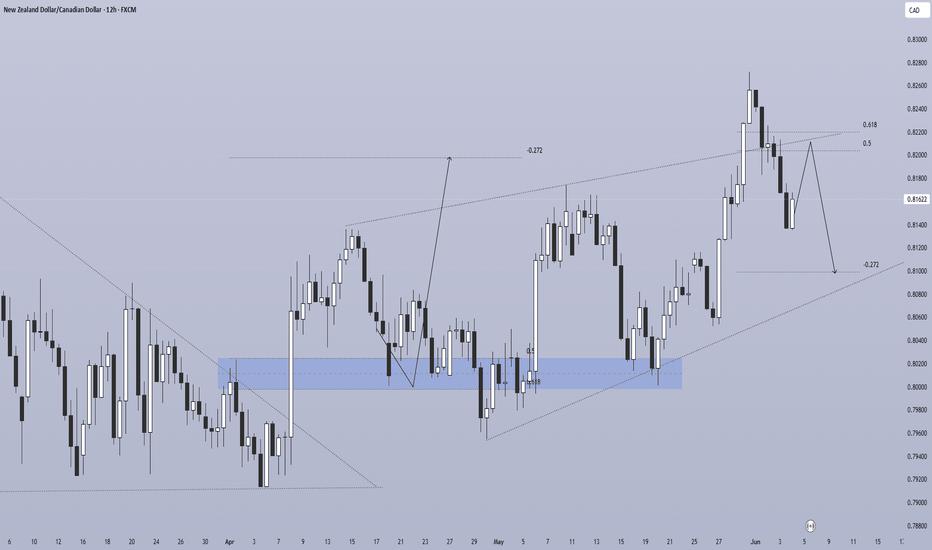
Market Structure
Descending channel from March broke upward in late April
Strong rally from 0.618 fib demand zone (0.8000–0.8020) — reacted twice
Price peaked at 0.8260 (June 1) — now pulling back
Pullback to 0.5–0.618 fib (~0.8180–0.8220) forming
Projected Scenario
🔴 Bearish short-term:
Rejection from current level
Dip to -0.272 ext. (~0.8100) — minor target
Potential retest of 0.618 fib zone (0.8000–0.8020)
🟢 Bullish medium-term:
Bounce from -0.272 / 0.618 zone
Continuation rally targeting -0.272 upper ext. (~0.8200+)
Pattern mirrors the April–May bounce structure
Bias Summary
Short-term: 🔴 Mild bearish — pullback to 0.8100–0.8020
Medium-term: 🟢 Bullish — bounce targets 0.8200+
Invalidation: Break below 0.7980 flips bias bearish
風險提示:本文所述僅代表作者個人觀點,不代表 Followme 的官方立場。Followme 不對內容的準確性、完整性或可靠性作出任何保證,對於基於該內容所採取的任何行為,不承擔任何責任,除非另有書面明確說明。

暫無評論,立馬搶沙發