


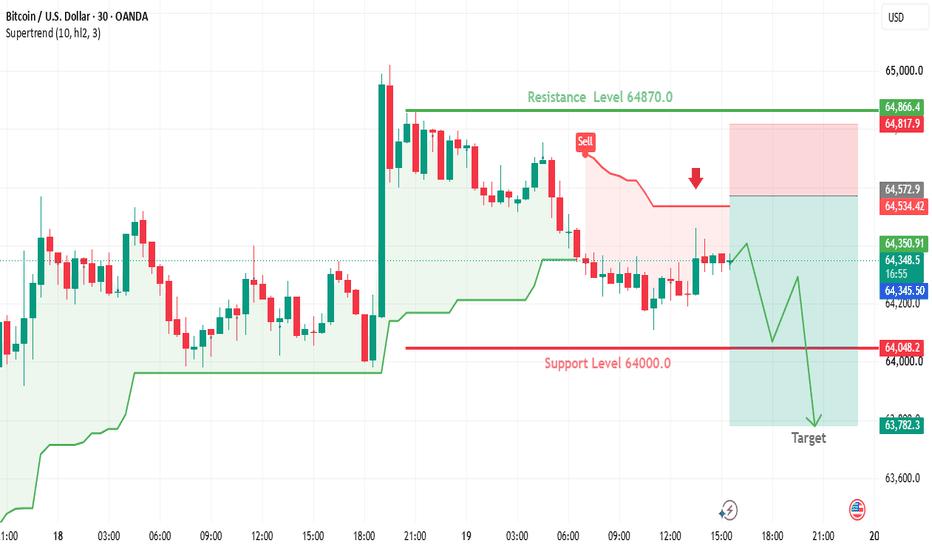
Chart Analysis (30-Minute Time Frame)
The chart shows Bitcoin (BTC/USD) trading around $64,361, with the market moving inside a short-term consolidation phase after failing to maintain momentum above the recent highs.
Key Technical Levels
Resistance: $64,870
Sell Zone: $64,572
Support: $64,000
Bearish Target: $63,782
Bearish Signals
The chart highlights a sell setup near $64,572, suggesting that sellers are defending this area.
Bitcoin failed to retest the $64,870 resistance level, indicating weakening bullish momentum.
The Supertrend indicator remains above the current market price, reinforcing the bearish outlook.
Recent candles show a series of lower highs, which often signals increasing selling pressure.
Trading Scenario
If BTC remains below $64,572, the bearish scenario could continue.
Rejection from the sell zone may push the price toward $64,000.
A breakdown below $64,000 could accelerate selling.
The next projected target is $63,782.
Invalidation Scenario
A sustained move above $64,870 would invalidate this bearish setup and could shift momentum back in favor of buyers.
風險提示:本文所述僅代表作者個人觀點,不代表 Followme 的官方立場。Followme 不對內容的準確性、完整性或可靠性作出任何保證,對於基於該內容所採取的任何行為,不承擔任何責任,除非另有書面明確說明。
 暫無留言。 來發表第一則觀點吧。