


USDCHF
### Chart Breakdown:
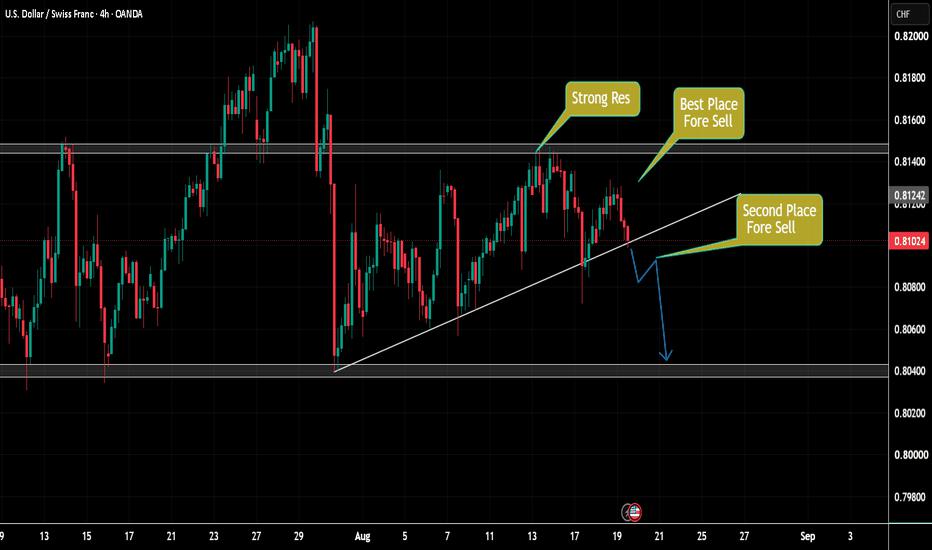
Price is in a Rising Wedge / Ascending Triangle pattern.
Abhi price wedge ki support trendline ke paas hai aur rejection ho raha hai. Chart pe already 2 sell zones marked hain.
### Key Levels Marked:
1. Current: ∼0.81026
2. Strong Res / Best Place For Sell: ∼0.81400 zone. Pehle bhi yaha se rejection aya tha
3. Second Place For Sell: Rising trendline support. Agar yaha se bounce fail ho to sell
4. Target: ∼0.80394 - Neeche wala grey support zone. Arrow bhi wahi point kar raha hai
### Scenario:
- Bearish Setup: Wedge ka breakout neeche hua to Target 0.80394 tak drop likely
- Sell 1: Strong Res 0.81400 se rejection par
- Sell 2: Trendline 0.81000 break hone par confirmation ke saath
- Bullish only if: 0.81400 break aur hold ho jaye
### Bias:
Bearish while below 0.81400. Wedge breakdown ka risk zyada hai.
Trendline break ke baad 0.80394 tak move expected.
Not financial advice. Wedge me fakeout bhi hota hai, confirmation candle
`USDCHF is forming a rising wedge on 4H chart.
Marked 2 key sell zones:
1. Strong Resistance 0.81400 - Best place to short
2. Trendline 0.81000 - Second sell on breakdown
If support breaks, next target 0.80394.
Bullish only above 0.81400.`
#USDCHF #Forex #TechnicalAnalysis #TradingSetup #ForexTrading
風險提示:本文所述僅代表作者個人觀點,不代表 Followme 的官方立場。Followme 不對內容的準確性、完整性或可靠性作出任何保證,對於基於該內容所採取的任何行為,不承擔任何責任,除非另有書面明確說明。
 暫無留言。 來發表第一則觀點吧。