


1. Technical Trend
Current bias: Bearish – short-term rebound within a broader corrective structure
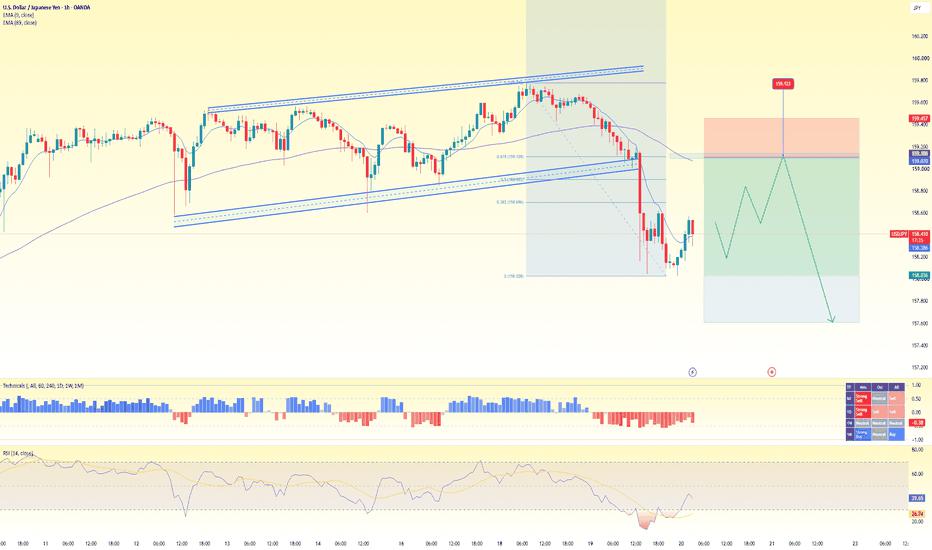
USD/JPY is trading around 158.42, slightly above EMA 9 ≈ 158.39, but still well below EMA 89 ≈ 159.07.
EMA 9 < EMA 89 → the H1 structure remains bearish.
Price has broken below the previous ascending channel, confirming a shift from bullish structure to a corrective/downside phase.
The current rebound from around 158.03 looks corrective rather than a confirmed trend reversal.
RSI(14) ≈ 39.9 has recovered from oversold conditions but remains below 50 → bearish momentum is still dominant.
Histogram remains negative → selling pressure has not fully disappeared.
2. Price Structure
Key H1 levels:
Current Price: ~158.42
Recent Low: ~158.03
Resistance: 158.90–159.10
Major Supply: 159.10–159.45
Downside Target: 158.03 → 157.60
The chart shows:
Ascending Channel → Breakdown → Sharp Sell-off → Technical Rebound → Potential Bearish Continuation
The 158.90–159.10 zone is particularly important because it combines the Fibonacci retracement area and the previous channel support.
-----------------------------------
SELL USDJPY zone : 159.100 - 159.200
SL : 159.600
TP : 158.700 - 158.200 - 157.600
----------------------------------
3. Fundamental Drivers
The fundamental backdrop currently favors the yen more than it did earlier in the month.
The U.S. dollar has weakened recently as markets reduced expectations of further Fed tightening following softer U.S. data. Reuters reported that expectations for a September Fed hike had fallen to 30.6% from 52.2% a week earlier.
The latest Fed minutes still showed significant concern about persistent inflation, with many officials willing to consider higher rates if inflation remains elevated. However, subsequent softer data have reduced the urgency for a September hike.
The U.S. Treasury's decision to double long-duration bond buybacks has recently pushed long-term Treasury yields lower and contributed to broad USD weakness. The 10-year yield was around 4.65% after the move.
風險提示:本文所述僅代表作者個人觀點,不代表 Followme 的官方立場。Followme 不對內容的準確性、完整性或可靠性作出任何保證,對於基於該內容所採取的任何行為,不承擔任何責任,除非另有書面明確說明。
 暫無留言。 來發表第一則觀點吧。