


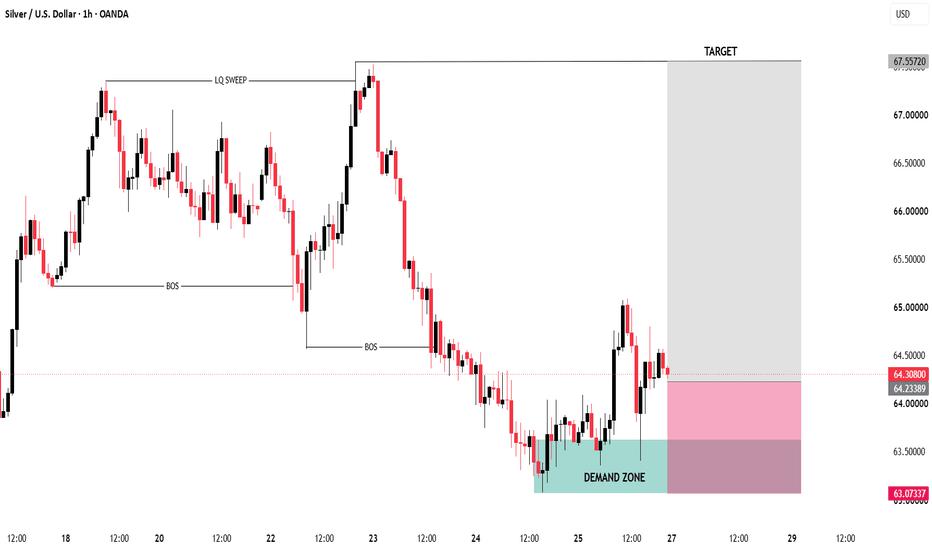
Silver is showing a clear bearish structure from the 67.50 area, with multiple lower highs and lower lows. However, the recent price action suggests a potential short-term structural recovery.
🔹 Price swept the previous liquidity around 67.30–67.50 before a strong bearish displacement.
🔹 The decline created successive BOS levels, confirming the prevailing bearish structure.
🔹 Price eventually reached the 63.30–63.60 demand zone, where selling pressure started to weaken.
🔹 From this zone, price produced a strong bullish reaction and pushed back toward 64.50–65.00.
🔹 Current price is consolidating around 64.30–64.50, so the reaction from the marked demand zone is the key area to observe.
🔹 A sustained break and close above the recent local high could strengthen the short-term bullish structure.
🔹 If the demand zone fails, the recent bullish recovery would be weakened and the broader bearish structure could regain control.
Key levels:
🟢 Demand: 63.30–63.60
⚪ Current structure: 64.30–64.50
🔺 Resistance / recent swing: 64.90–65.10
🔺 Major liquidity area: 67.30–67.50
📌 Educational focus: Liquidity sweep → displacement → BOS → demand-zone reaction → structure confirmation
風險提示:本文所述僅代表作者個人觀點,不代表 Followme 的官方立場。Followme 不對內容的準確性、完整性或可靠性作出任何保證,對於基於該內容所採取的任何行為,不承擔任何責任,除非另有書面明確說明。
 暫無留言。 來發表第一則觀點吧。
