


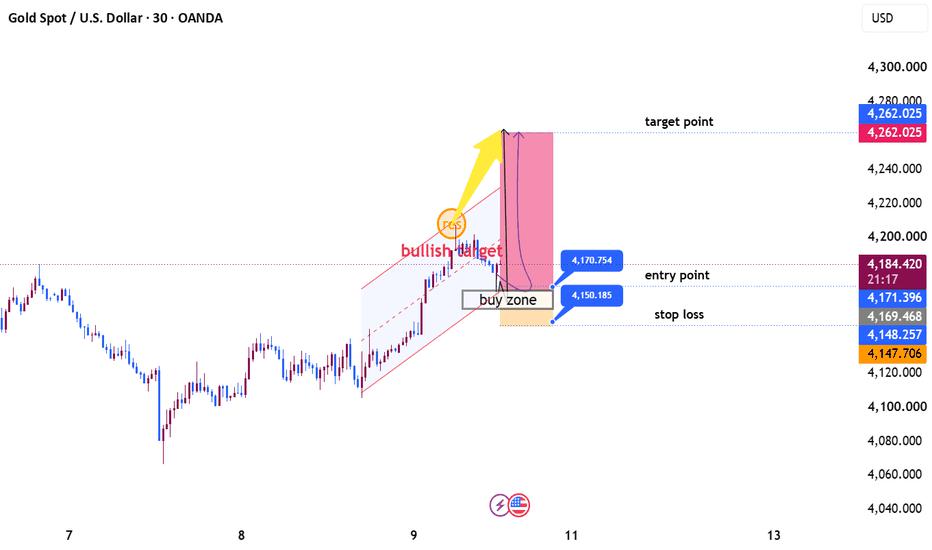
XAU/USD Gold Technical Analysis – 30-Minute Chart
Overall bias: Bullish, but a pullback is possible.
Gold is trading around 4,185.150 after a strong upward move from the 4,100–4,120 area. The chart shows price moving inside an ascending channel, with higher highs and higher lows supporting the bullish structure. However, price is approaching resistance, so a retracement toward the marked buy zone could occur before another upward move.
Key Technical Levels
Level
Price
Significance
Target
4,262.025
Major upside objective
Resistance
4,200–4,220
Potential selling pressure
Current price
4,185.150
Near-term decision area
Entry zone
4,150–4,171
Potential bullish retracement
Stop-loss area
Below 4,148
Trade invalidation zone
Possible Trade Scenarios
1. Bullish scenario
If price retraces into the 4,150–4,171 buy zone and shows bullish confirmation, buyers may regain control.
A break above 4,200–4,220 could open the way toward higher resistance and potentially the 4,262 target.
The bullish setup weakens if price breaks below the marked support zone.
2. Bearish scenario
If price loses 4,150–4,148 with strong bearish momentum, the bullish setup may fail.
Gold could then move toward lower support around 4,120–4,100.
Liquidity and Market Structure
Buy-side liquidity: Potentially rests above recent highs around 4,200 and toward 4,220.
Demand zone: The marked 4,150–4,171 region is the area to watch for a possible bounce.
Trend structure: The ascending channel favors buyers while its lower boundary and recent swing lows hold.
Confirmation: Watch for a rejection wick, a bullish engulfing candle, or a break of a short-term lower high before considering a long entry.
Conclusion: The 30-minute structure remains bullish, but chasing price near resistance carries risk. Waiting for a pullback and confirmation around the buy zone offers a more structured setup. The 4,262 target is a possible objective, not a guaranteed outcome.
風險提示:本文所述僅代表作者個人觀點,不代表 Followme 的官方立場。Followme 不對內容的準確性、完整性或可靠性作出任何保證,對於基於該內容所採取的任何行為,不承擔任何責任,除非另有書面明確說明。
 暫無留言。 來發表第一則觀點吧。