NAS100
Nasdaq 100 Index
 關註
25205.10
-1344.50
(-5.06%)
Prices By Followme , in USD
數據
LOW
HIGH

25144.20
26484.20
1 W
-9.74%
1 MO
-11.24%
3 MO
-14.46%
6 MO
-16.91%

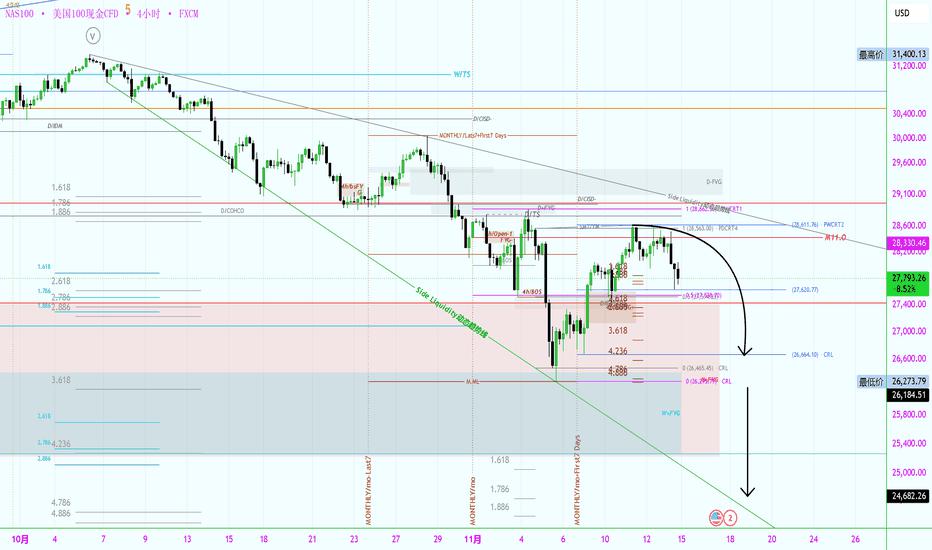
纳斯达克下周展望
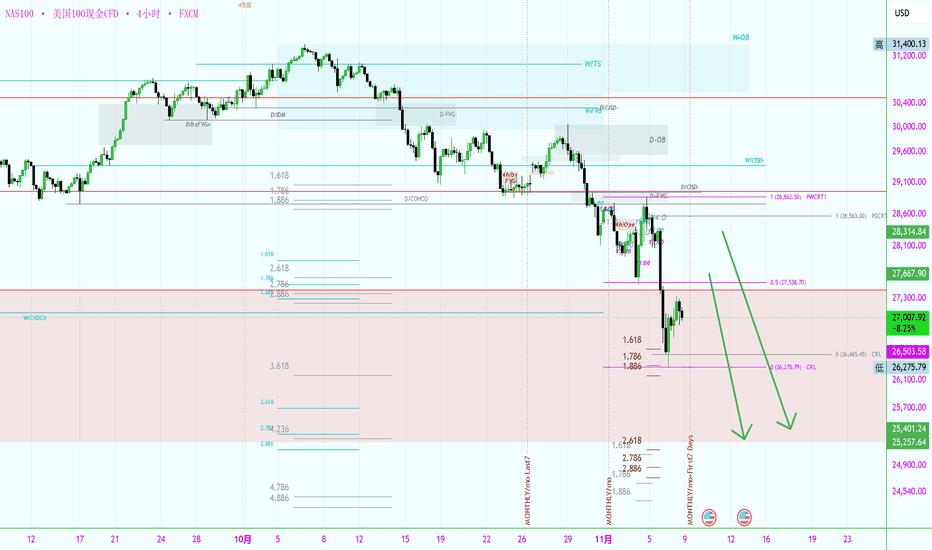
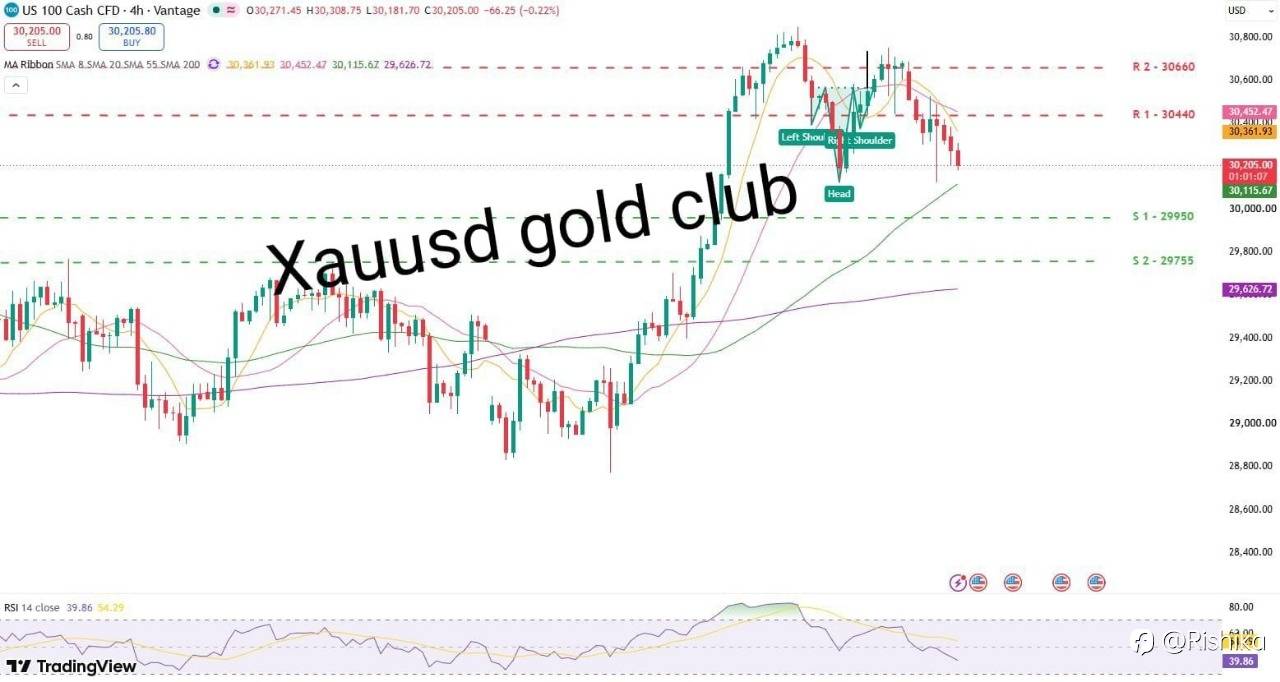
#NAS100# 纳斯达克上周暴跌到达2025年的最高点反弹,合情合理。且下方是高时间框架的PDA,肯定是要反弹的。这里的核心蜡烛图就是上周四的蜡烛图,本周到达它的高点,提取了流动性,从本周收盘蜡烛图看,下周一就要延续下跌。下周目标首先就是本周低点,然后是上周最低点。如果上周最低点下破,就是我标注的1.618-1.886的区域,完成最高点顶部信号目标4.236-4.886区域。那这里可能又要大反弹的。从时间窗口上的价格行为看11月份阴线。上周低点不是最低点。从目前的走势看,这是一个下跌扩大三角形,下跌和反弹波动空间会比较大,注意安全,大家交易顺利。



Trade Truce Extended, but a Hawkish Fed Keeps the Dollar Bid
MARKET REVIEW FOREX US-CHINA Trade Truce Extended, but a Hawkish Fed Keeps the Dollar Bid Washington and Beijing gave themselves two more months before Xi and Trump even sat down. With US yields above 5% and business activity running hot, though, the Fed is still what's moving the doll

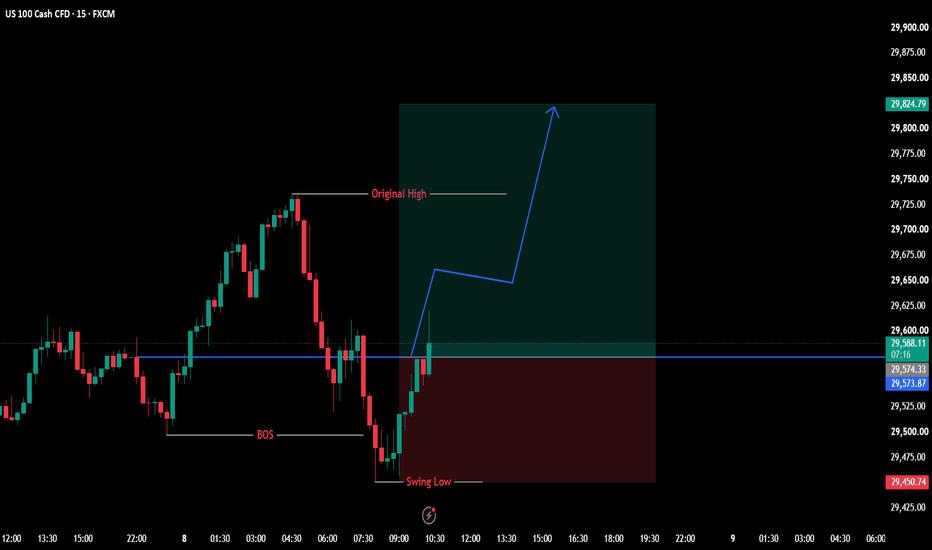
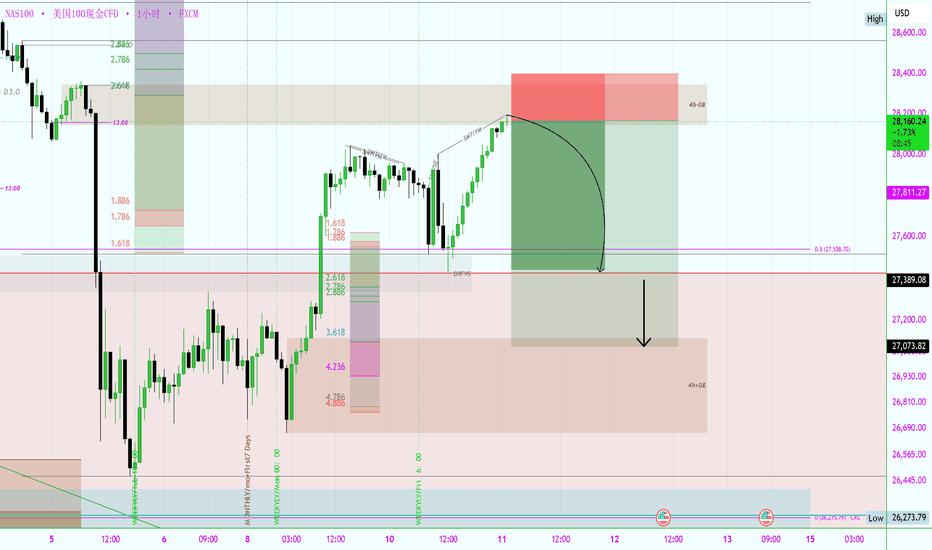
#NAS100USD Buy Trade Scenario.
#NAS100# Asset: US100 (Nasdaq 100) Timeframe: 15 Minutes (M15) Direction: BUY / LONG 🟢 Entry Price: 28,234.49 Stop Loss (SL): 28,137.01 Take Profit (TP): 28,430.24 ⚖️ Risk-to-Reward Ratio: 1:2.01 📈 TRADE ANALYSIS A bullish trading opportunity targeting the upside, with a clearly defin
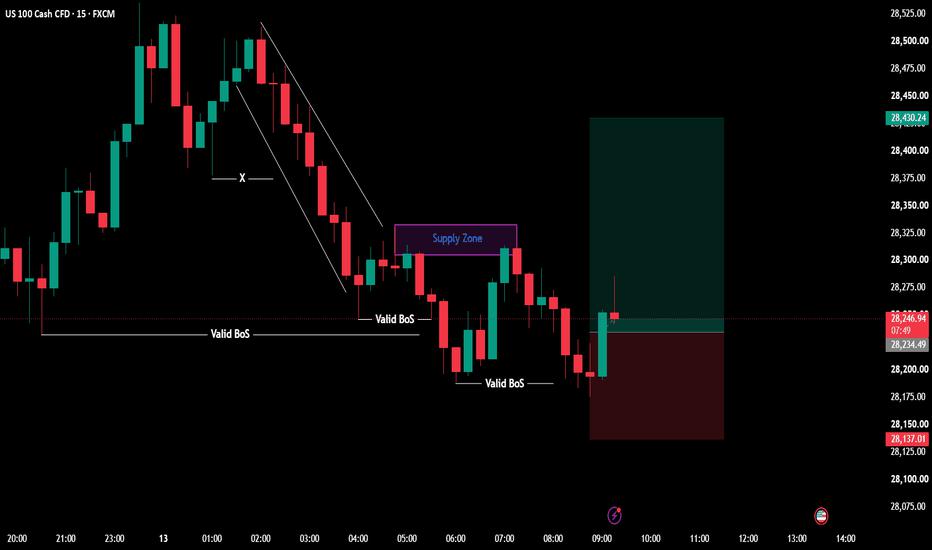
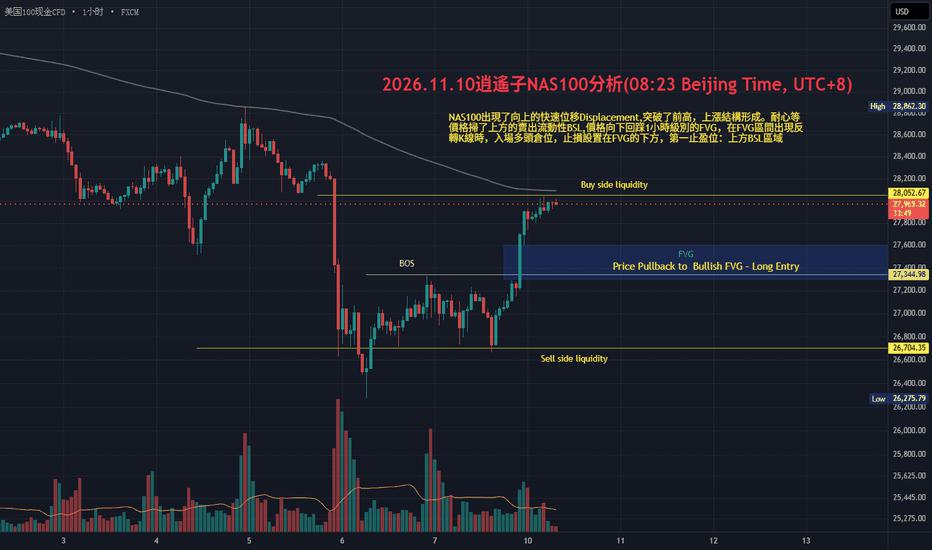
2026.11.10逍遙子NAS100分析(08:23 Beijing Time, UTC+8)
#NAS100# NAS100出現了向上的快速位移Displacement,突破了前高,上漲結構形成。耐心等 價格掃了上方的賣出流動性BSL,價格向下回踩1小時級別的FVG,在FVG區間出現反 轉K線時,入場多頭倉位,止損設置在FVG的下方,第一止盈位:上方BSL區域




US100 SELL TRADE UPDATE
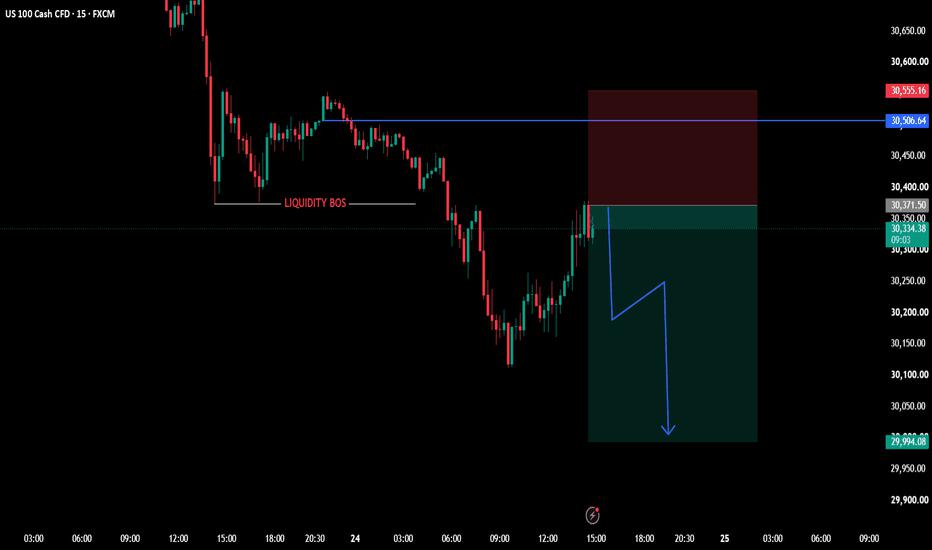
#NAS100# 🔻 US100 — SELL SETUP | TradingView Update 📌 Asset: US100 Cash CFD ⏱️ Timeframe: 15M 📉 Bias: SELL / Bearish 🔻 Entry: 30,371.50 🛑 Stop Loss: 30,555.16 🎯 Take Profit: 29,994.08 ⚖️ Risk-Reward: Approx. 1:2.05 Market Structure: Price is showing bearish momentum after a liquidi
NAS100 Sell UPDATE
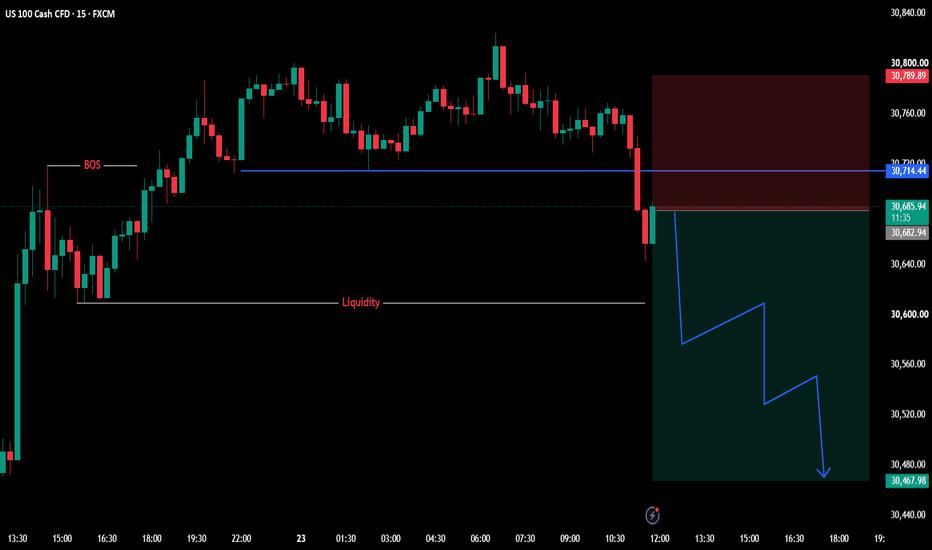
#NAS100# 🔻 US100 / NAS100 — SELL Setup 📊 Asset: US100 Cash CFD ⏱️ Timeframe: 15 Minutes 📉 Bias: Bearish / SELL 🔻 Entry: 30,682.94 🛑 Stop Loss: 30,789.89 🎯 Take Profit: 30,467.98 ⚖️ Risk-Reward: Approx. 1:2.01 📌 Technical Analysis US100 has shown a strong bearish rejection after f
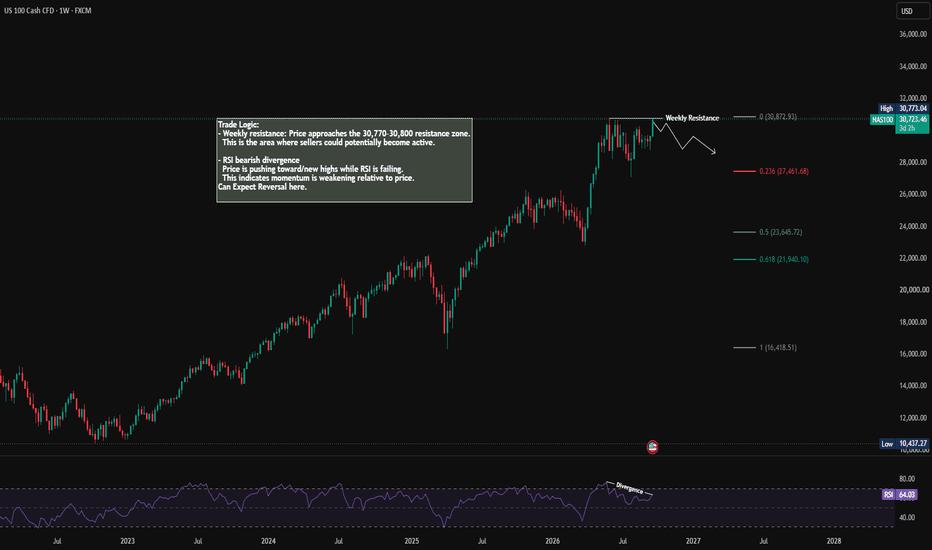
NAS100
#NAS100# Trade Logic: - Weekly resistance: Price approaches the 30,770–30,800 resistance zone. This is the area where sellers could potentially become active. - RSI Bearish Divergence Price is pushing toward/new highs while RSI is failing. This indicates momentum is weakening relative t