
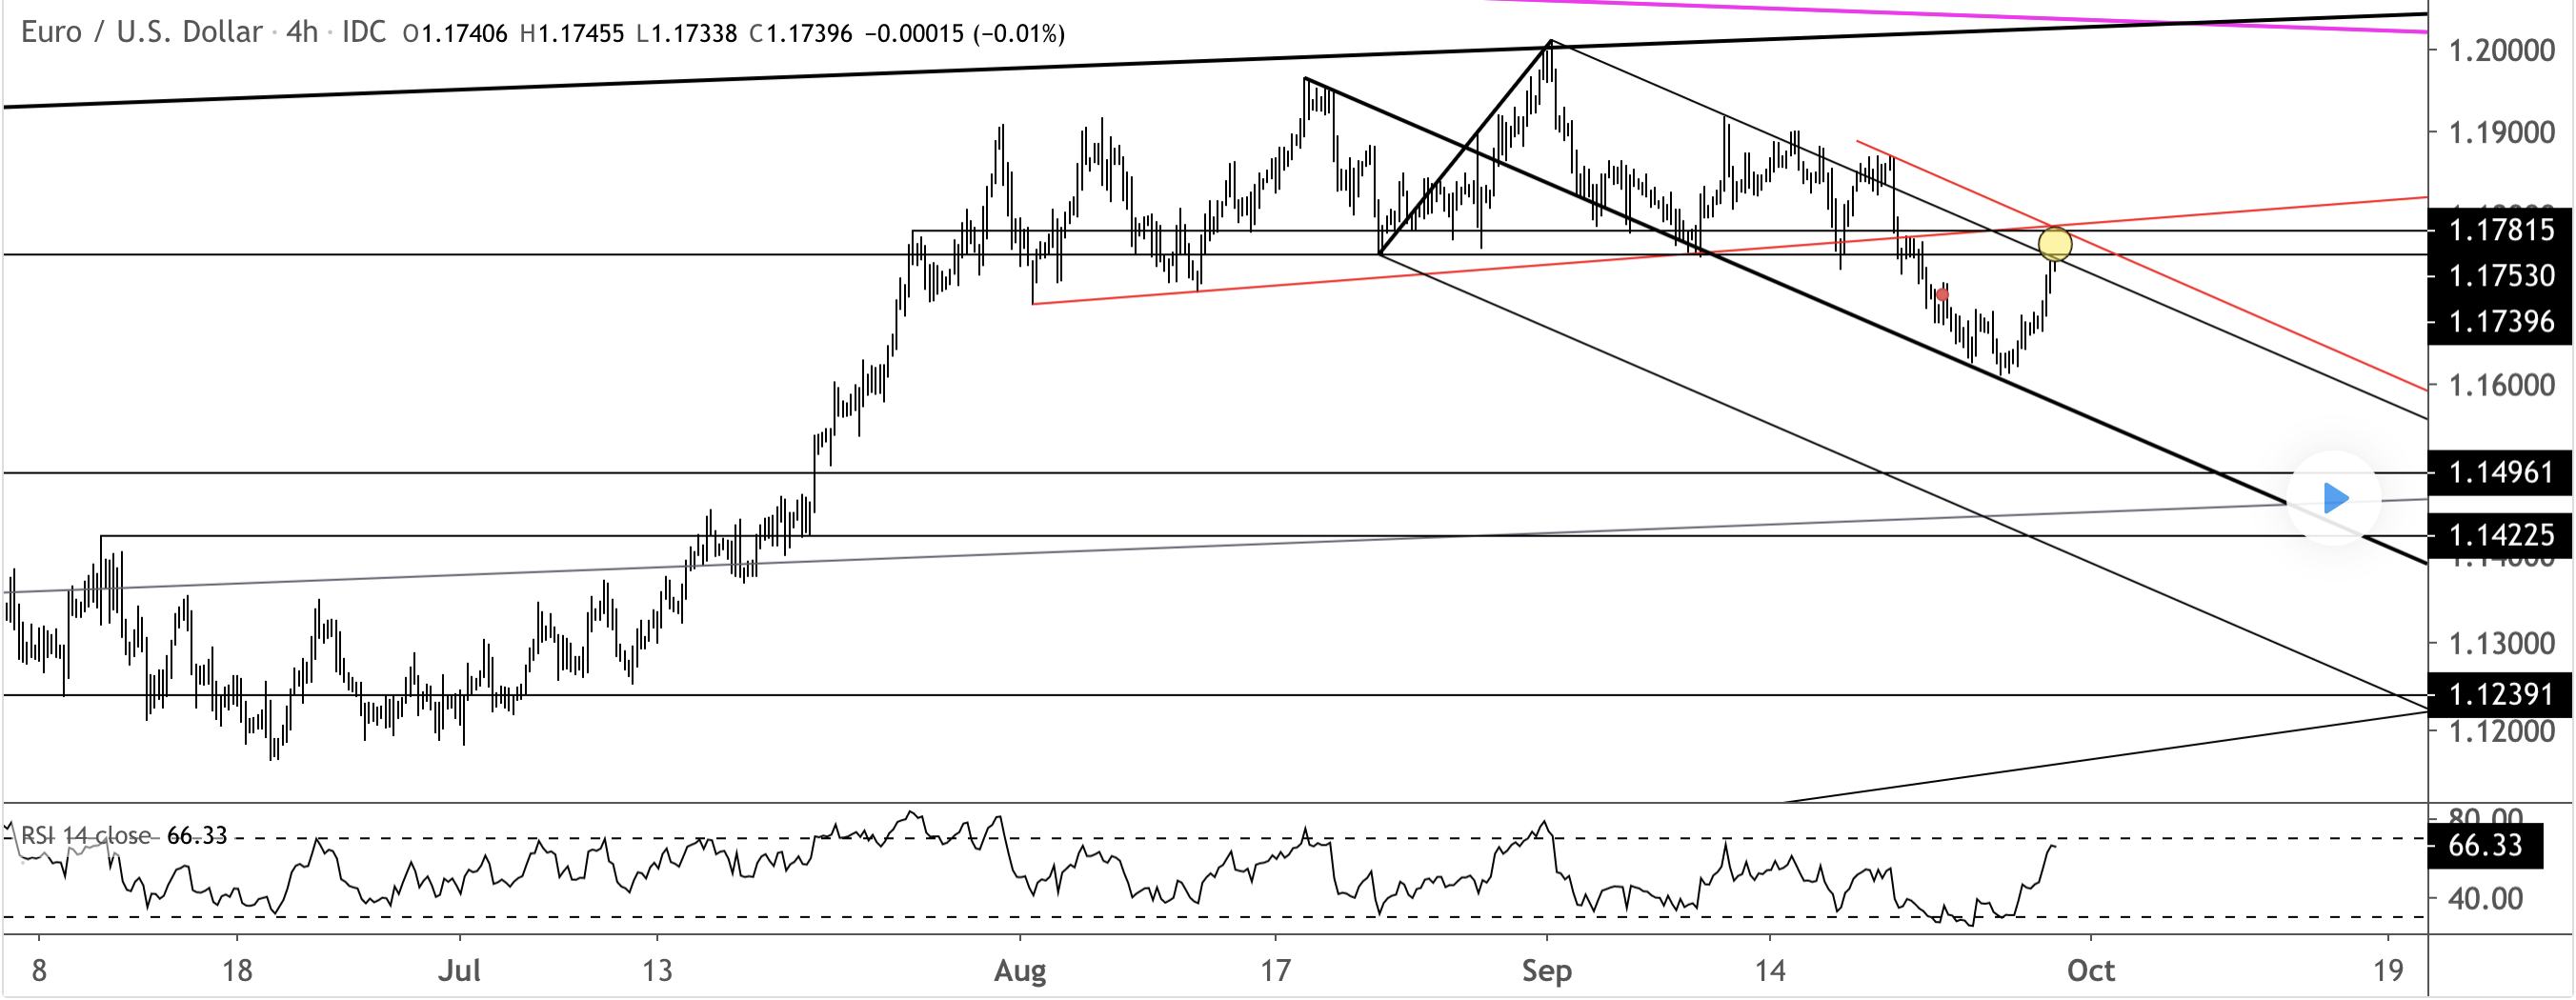
EURUSD Wyckoff Distribution Schematic
We last looked at the Wyckoff Distribution Schematic on 9/14. To review:
I’m showing a Euro futures chart because volume must be incorporated when analyzing a market from a Wyckoff perspective. Volume on SOW (sign of weakness) days are highlighted with yellow circles. Notice how volume expanded into the BC (buying climax) and decreased on the ST (secondary test). A drop below 1.1750 is required in order to complete the distribution.
#EUR/USD#
風險提示:本文所述僅代表作者個人觀點,不代表 Followme 的官方立場。Followme 不對內容的準確性、完整性或可靠性作出任何保證,對於基於該內容所採取的任何行為,不承擔任何責任,除非另有書面明確說明。
 暫無留言。 來發表第一則觀點吧。