


WTI PRICE ANLYSIS: DAILY CHART
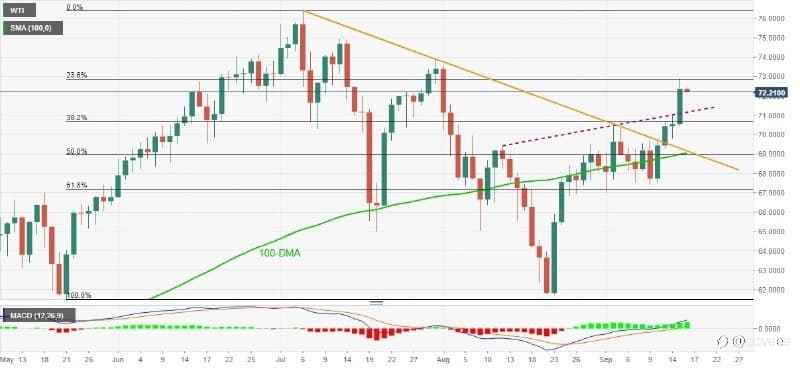
WTI combines weekly gains around multi-day high, 0.20% intraday near $72.20 during early Thursday. The oil standard jumped to the highest level since August 02 but failed to cross 23.6% Fibonacci retracement of May–July upside.
Even so, bullish MACD and the Oil's ability to cross monthly resistance line, falling trend line from early July, also stay firmer beyond 100-DMA, keep WTI oil buyers confident.
As of now, an upside clearance of the 23.6% Fibonacci retracement level of $72.85 will aim for July 30 top of $73.88 and the mid-July peak surrounding $75.00
Hello Traders keep a close look at oil's price for we are still expecting a bullish continuation meaning Buyers can still take advantage of this movement and turn this into profit however scalpers can also earn from the minor bounce back down or its retracement cause price might go down before it continues its bullish movement
風險提示:本文所述僅代表作者個人觀點,不代表 Followme 的官方立場。Followme 不對內容的準確性、完整性或可靠性作出任何保證,對於基於該內容所採取的任何行為,不承擔任何責任,除非另有書面明確說明。
 暫無留言。 來發表第一則觀點吧。
