NZD/USD DAILY CHART ANALYSIS
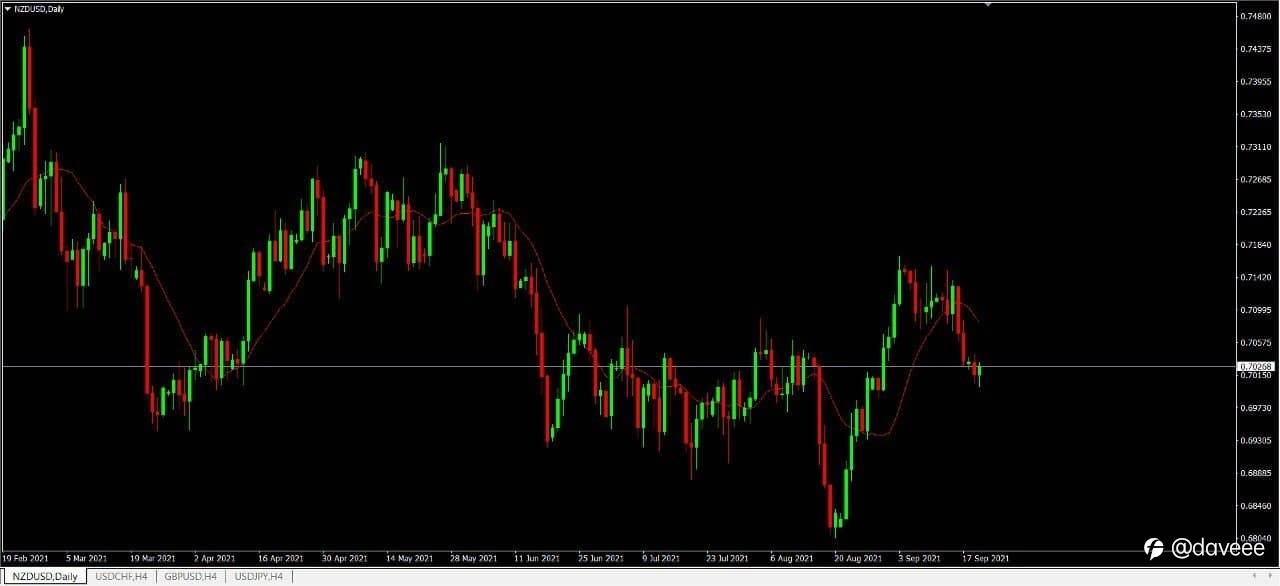
Always keep track that a head-and-shoulders position materialized in the first quarter of 2021 as NZD/USD slipped below the 50-Day SMA (0.7006) this is the first time this has happened since November, with the exchange rate pushing below the 200-Day SMA (0.7116) for the first time since June 2020 to trade to a fresh yearly low (0.6805) in August.
Although, NZD/USD reversed course ahead of the November 2020 low (0.6589) among the failed attempt to close below the 0.6810 (38.2% expansion) region, with a bull flag formation taking shape earlier this month as the exchange rate cleared the July high (0.7105).
☎️ Telegram : https://t.me/MU_I09
📧 Email: [email protected]
#cpt #cptinternational #gold #forex #crudeoil #currency #investment #stock #mt4 #tradingapp #trading #technicalanalysis #USD #NZD @CPT International
風險提示:本文所述僅代表作者個人觀點,不代表 Followme 的官方立場。Followme 不對內容的準確性、完整性或可靠性作出任何保證,對於基於該內容所採取的任何行為,不承擔任何責任,除非另有書面明確說明。

暫無評論,立馬搶沙發