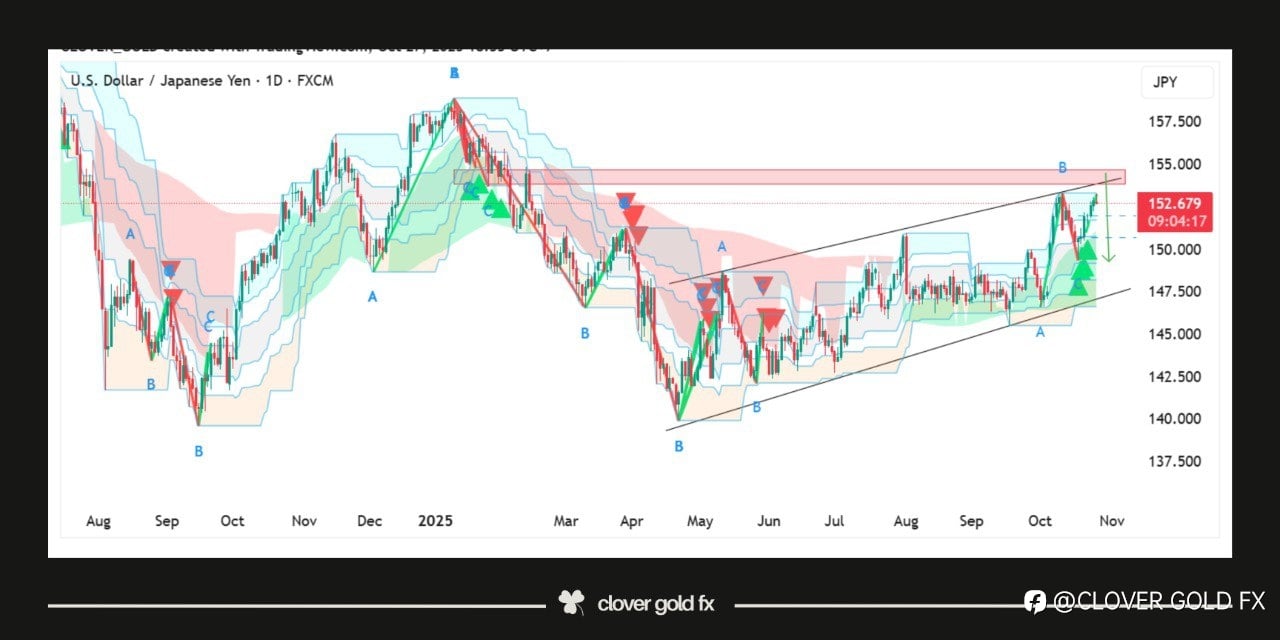
USDJPY shows a bearish setup on the daily chart as the pair has reached the golden Fibonacci resistance level and started to face strong rejection from that zone the structure forms an ending diagonal pattern suggesting potential downside pressure the highlighted red arrows indicate a possible drop as price completes the final wave E of the pattern momentum is losing strength near the upper trendline confirming the likelihood of reversal sellers may take control soon leading to a downward correction toward the lower boundary of the channel this setup reflects a shift from bullish exhaustion to bearish momentum in the coming sessions
風險提示:本文所述僅代表作者個人觀點,不代表 Followme 的官方立場。Followme 不對內容的準確性、完整性或可靠性作出任何保證,對於基於該內容所採取的任何行為,不承擔任何責任,除非另有書面明確說明。

暫無評論,立馬搶沙發