


#xauusd #xᴀᴜᴜsᴅ
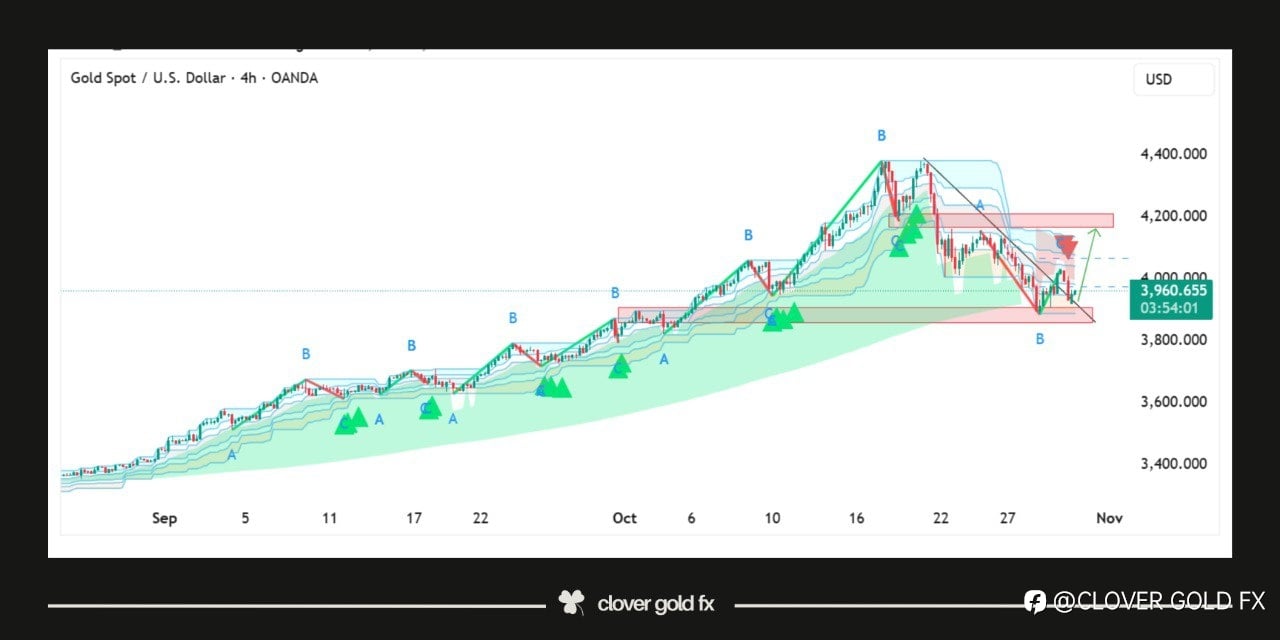
Gold on the 4H chart shows that the market completed a five wave bullish structure and after reaching the top it started a corrective phase that moved down in three clear waves labeled a b and c the price is reacting around the horizontal support zone where buyers are trying to regain control the descending trend line marks the limit of the corrective phase and a breakout above it may indicate the start of a fresh upward movement the pattern suggests that gold might build strength around this area before targeting higher levels again showing a possible shift from correction to continuation of the overall bullish trend
風險提示:本文所述僅代表作者個人觀點,不代表 Followme 的官方立場。Followme 不對內容的準確性、完整性或可靠性作出任何保證,對於基於該內容所採取的任何行為,不承擔任何責任,除非另有書面明確說明。
 暫無留言。 來發表第一則觀點吧。