


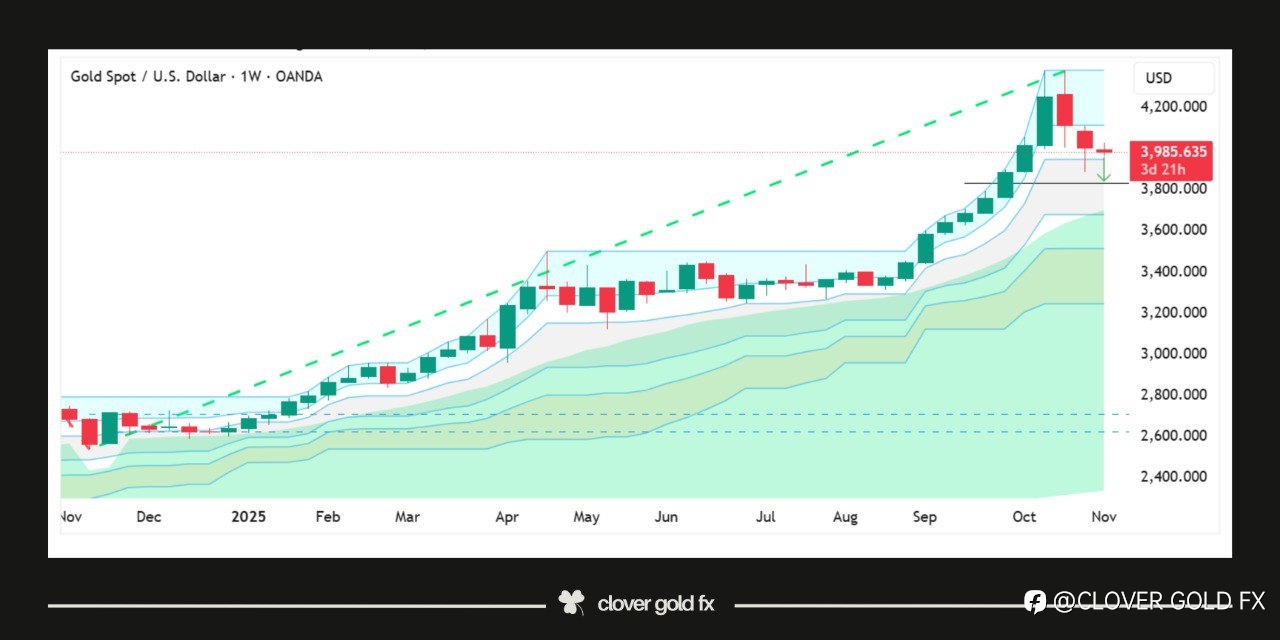
After completing a strong nine-week bullish sequence on the weekly chart, XAUUSD appears to be entering a corrective phase that mirrors previous market behavior seen after extended impulsive rallies. Historically, such prolonged bullish runs often trigger profit-taking and short-term reversals as momentum fades and institutional traders rebalance positions. The current structure shows signs of exhaustion at the top, with a shift from large impulsive candles to smaller corrective ones, suggesting reduced buying pressure. If history repeats, gold may retrace toward the 50% Fibonacci zone, a level that often acts as a natural equilibrium between buyers and sellers before the broader trend resumes. This area also aligns with prior consolidation zones, making it a potential demand region where new accumulation could begin if the long-term uptrend remains intact.
風險提示:本文所述僅代表作者個人觀點,不代表 Followme 的官方立場。Followme 不對內容的準確性、完整性或可靠性作出任何保證,對於基於該內容所採取的任何行為,不承擔任何責任,除非另有書面明確說明。
 暫無留言。 來發表第一則觀點吧。