#cadchf #cad #chf
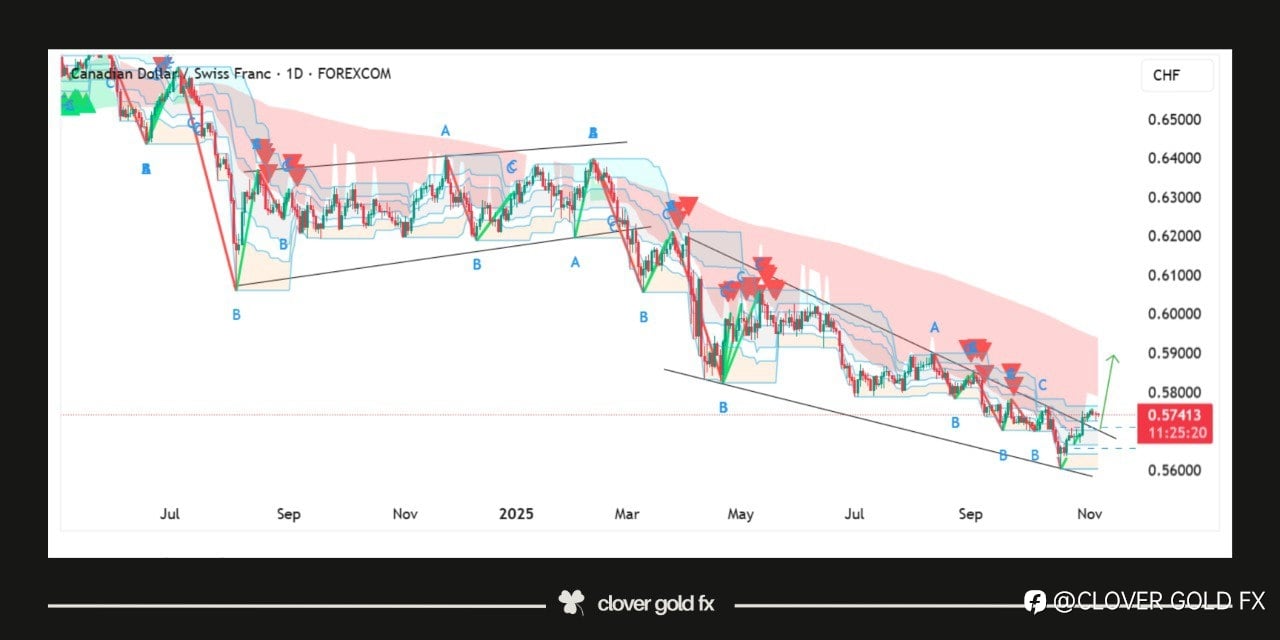
The CADCHF 14H chart shows that the pair has been trading in a clear downtrend forming a falling wedge pattern after an extended bearish move. The recent solid breakout from the wedge signals a potential shift in momentum as buyers start gaining strength. The breakout candle indicates increased bullish activity suggesting that the market may attempt a corrective rally toward the next resistance area shown by the red arrow. This upward move represents a possible reversal phase where price could retest previous structure levels before deciding its next major direction. Overall the chart reflects early signs of recovery with the breakout acting as a key confirmation for short term bullish continuation.
風險提示:本文所述僅代表作者個人觀點,不代表 Followme 的官方立場。Followme 不對內容的準確性、完整性或可靠性作出任何保證,對於基於該內容所採取的任何行為,不承擔任何責任,除非另有書面明確說明。

暫無評論,立馬搶沙發